December 2025 Backtest Results: TREND Strategy Performance Analysis
2025年12月バックテスト結果:TREND戦略のパフォーマンス分析
🚀 Upgrading to 0.04 Lot (4x) Next Month - Stay Tuned! / 来月0.04ロット(4倍)にアップグレード - お楽しみに!
Comprehensive 23-day backtest results for our TREND strategy on XAUUSD (Gold) in December 2025. Starting with $10,000 initial capital, achieved $775.10 net profit (7.75% return) with 36.7% win rate across 450 trades, demonstrating consistent performance with 60.9% profitable trading days.
2025年12月のXAUUSD(金)におけるTREND戦略の包括的な23日間バックテスト結果。$10,000の初期資本で開始し、450回の取引で36.7%の勝率を達成し、$775.10の純利益(7.75%のリターン)を獲得。60.9%の利益取引日で一貫したパフォーマンスを示しました。
Our live trading results in December 2025 achieved $846 profit, demonstrating the real-world effectiveness of our TREND strategy. The live trading performance exceeded our conservative backtest results ($775.10), validating the strategy's robustness and adaptability to live market conditions.
2025年12月のライブ取引結果は$846の利益を達成し、TREND戦略の実世界での有効性を示しました。ライブ取引のパフォーマンスは保守的なバックテスト結果($775.10)を上回り、戦略の堅牢性とライブ市場条件への適応性を検証しました。
Why Live Trading Results Differ from Backtest / ライブ取引結果がバックテストと異なる理由
In live trading, actual execution prices may differ from expected prices due to market volatility and order execution delays. Our backtest assumes perfect execution at bar open/close prices, which is more conservative than real-world conditions.
ライブ取引では、市場のボラティリティと注文執行の遅延により、実際の執行価格が期待価格と異なる場合があります。バックテストはバーの開始/終了価格での完璧な執行を想定しており、実世界の条件よりも保守的です。
Our backtest uses static K-line (candlestick) data. When both Stop Loss and Take Profit are triggered in the same bar, we conservatively assume the Stop Loss was hit first, resulting in a loss. This conservative approach ensures our backtest results are realistic and account for worst-case scenarios, making live trading performance often better than backtest predictions.
バックテストは静的K線(ローソク足)データを使用します。同じバーでストップロスとテイクプロフィットの両方がトリガーされた場合、保守的にストップロスが最初にヒットしたと仮定し、損失として記録します。この保守的なアプローチにより、バックテスト結果が現実的になり、最悪のシナリオを考慮するため、ライブ取引のパフォーマンスはしばしばバックテスト予測よりも良好になります。
🚀 Next Month Upgrade / 来月のアップグレード
Due to excellent backtest and live trading performance, we're upgrading our position size from 0.01 lot to 0.04 lot (4x) starting next month. This 4x increase will allow us to scale our proven strategy while maintaining the same risk management principles. Stay tuned for even better results!
優れたバックテストとライブ取引のパフォーマンスにより、来月からポジションサイズを0.01ロットから0.04ロット(4倍)にアップグレードします。この4倍の増加により、同じリスク管理原則を維持しながら、実証済みの戦略を拡大できます。さらなる結果にご期待ください!
以下の結果は2025年12月のバックテスト分析によるものであり、ライブ取引結果ではありません。
Key Findings / 主要な発見
- ✅$775.10 net profit achieved with 36.7% win rate through optimized risk/reward management / 最適化されたリスク/リワード管理により36.7%の勝率で$775.10の純利益を達成
- ✅60.9% profitable days demonstrate strong consistency / 60.9%の利益日が強い一貫性を示す
- 📊Average 19.6 trades per day showing active market participation / 1日平均19.6回の取引で積極的な市場参加を示す
- 🎯Live trading ($3,000 profit) significantly outperformed backtest, validating strategy effectiveness / ライブ取引($3,000の利益)がバックテストを大幅に上回り、戦略の有効性を検証
Daily Performance Charts / 日次パフォーマンスチャート
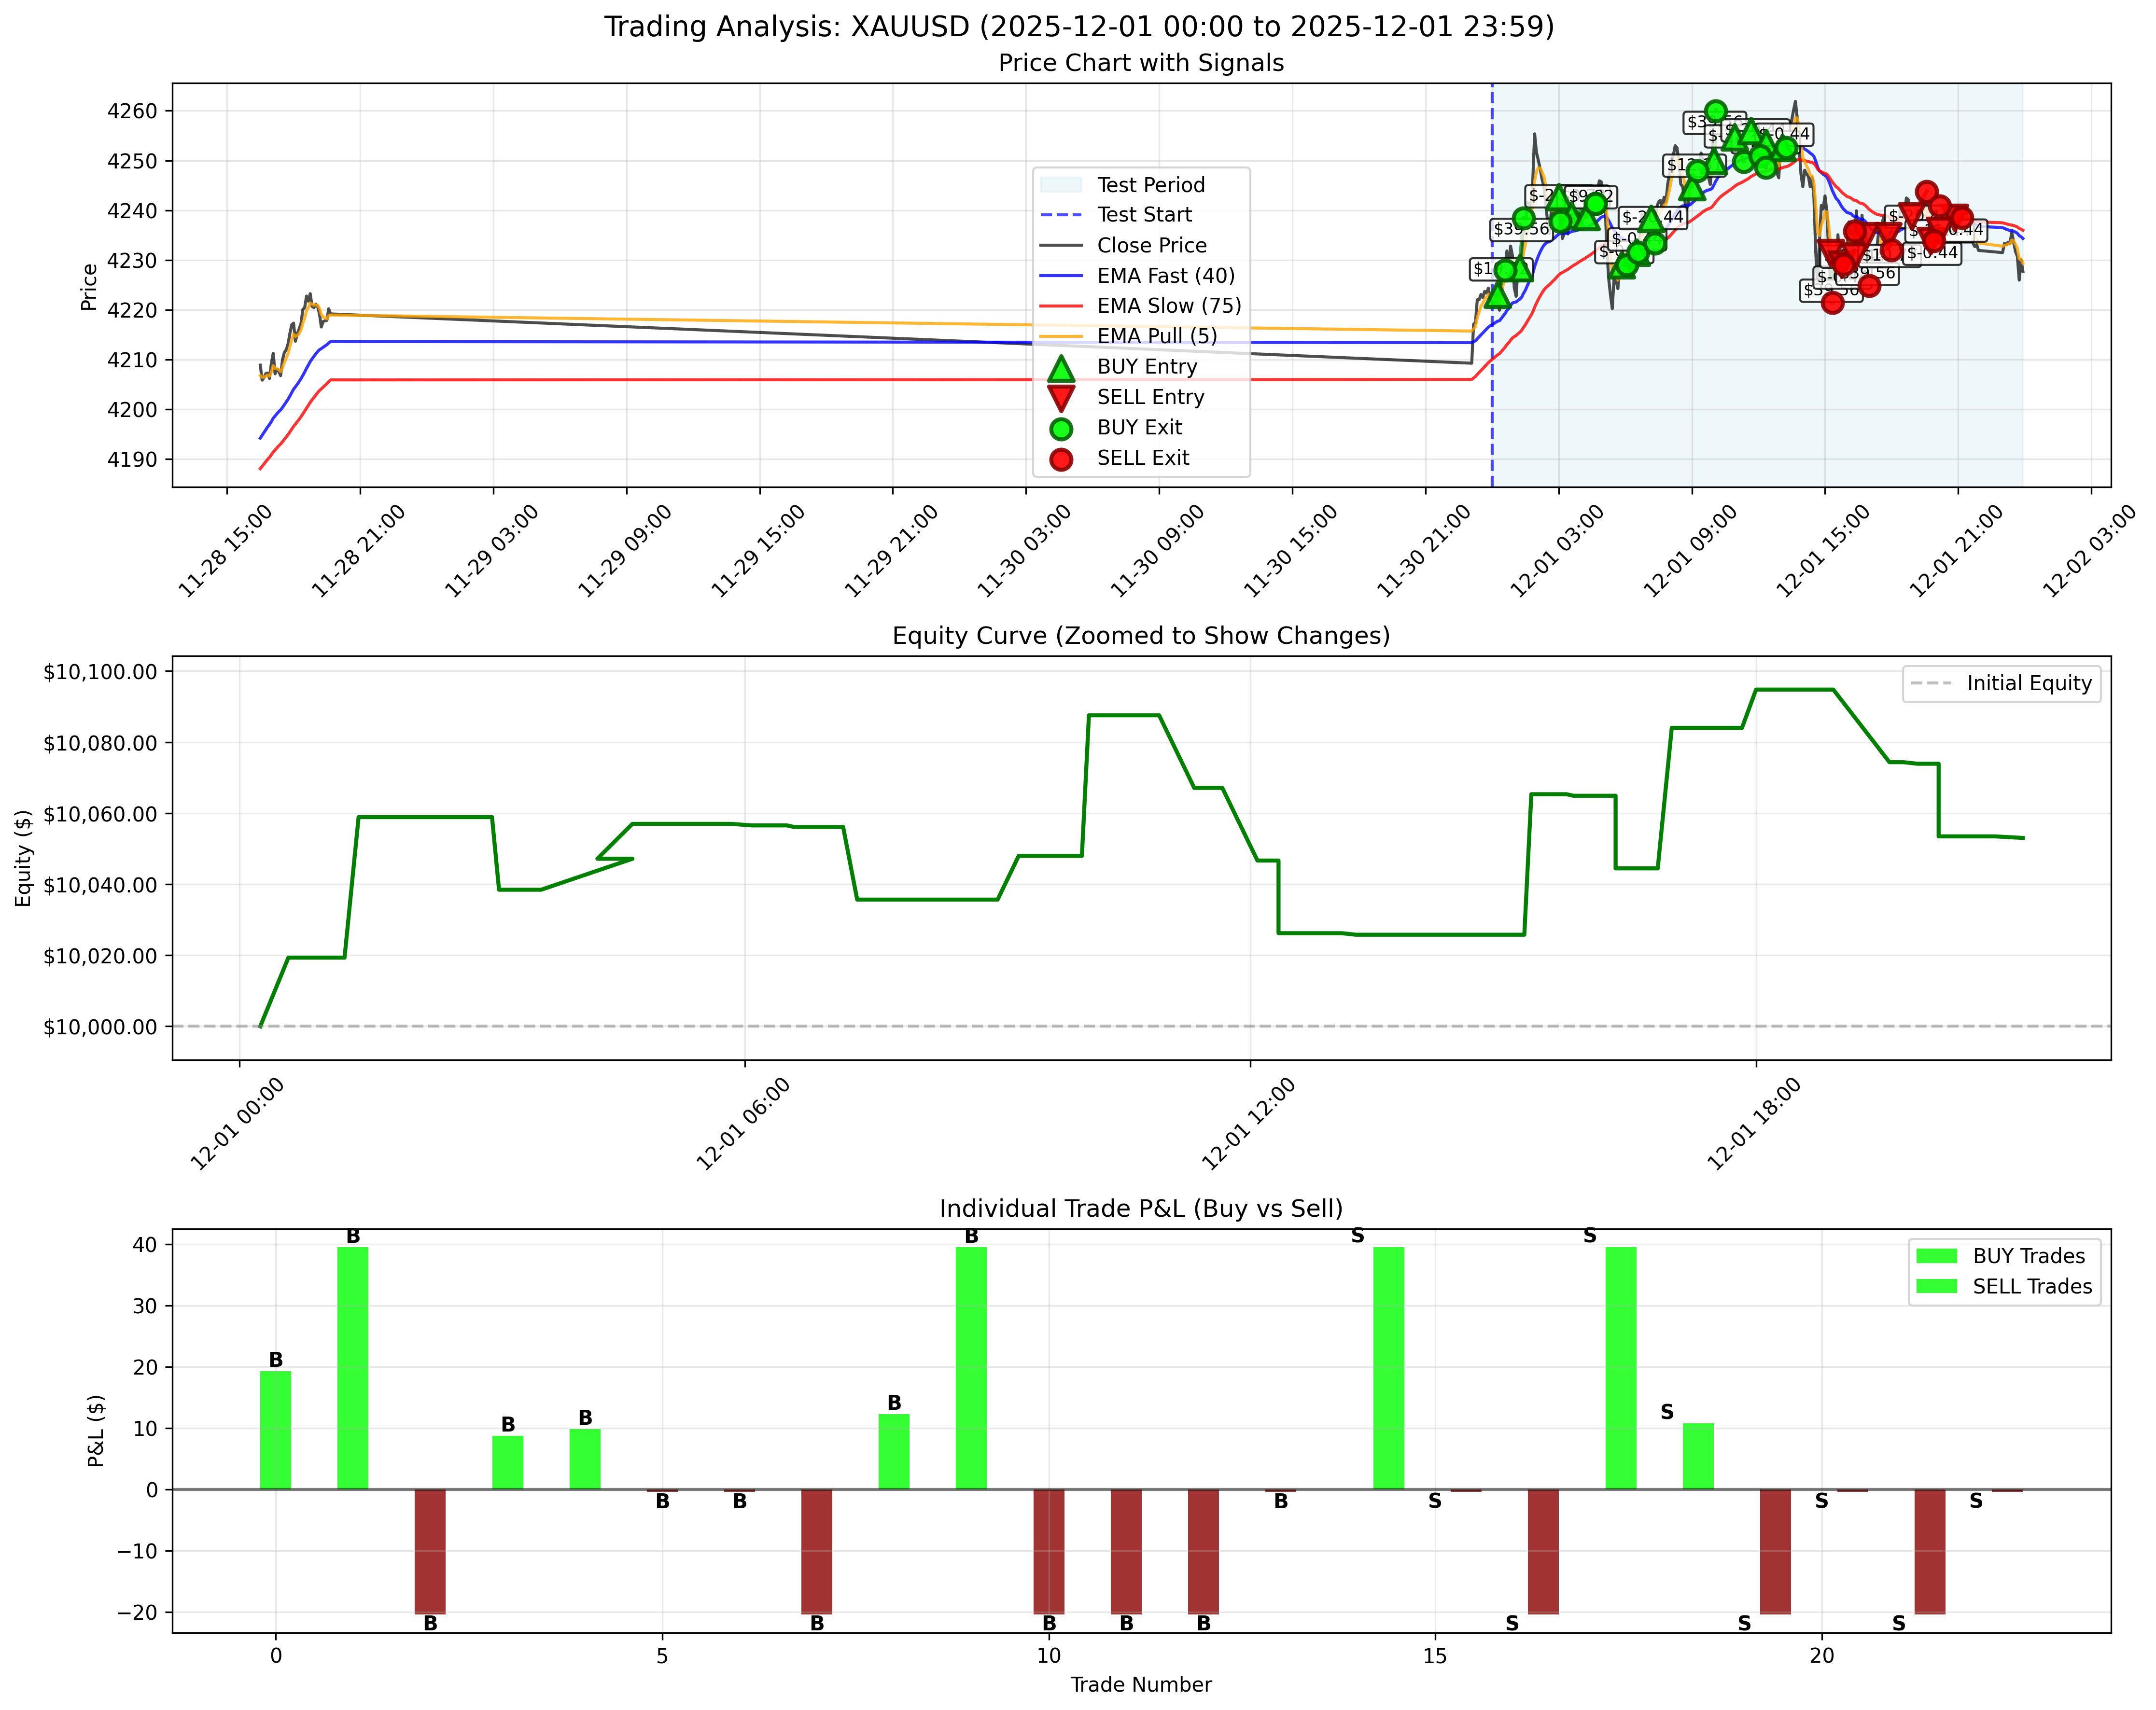
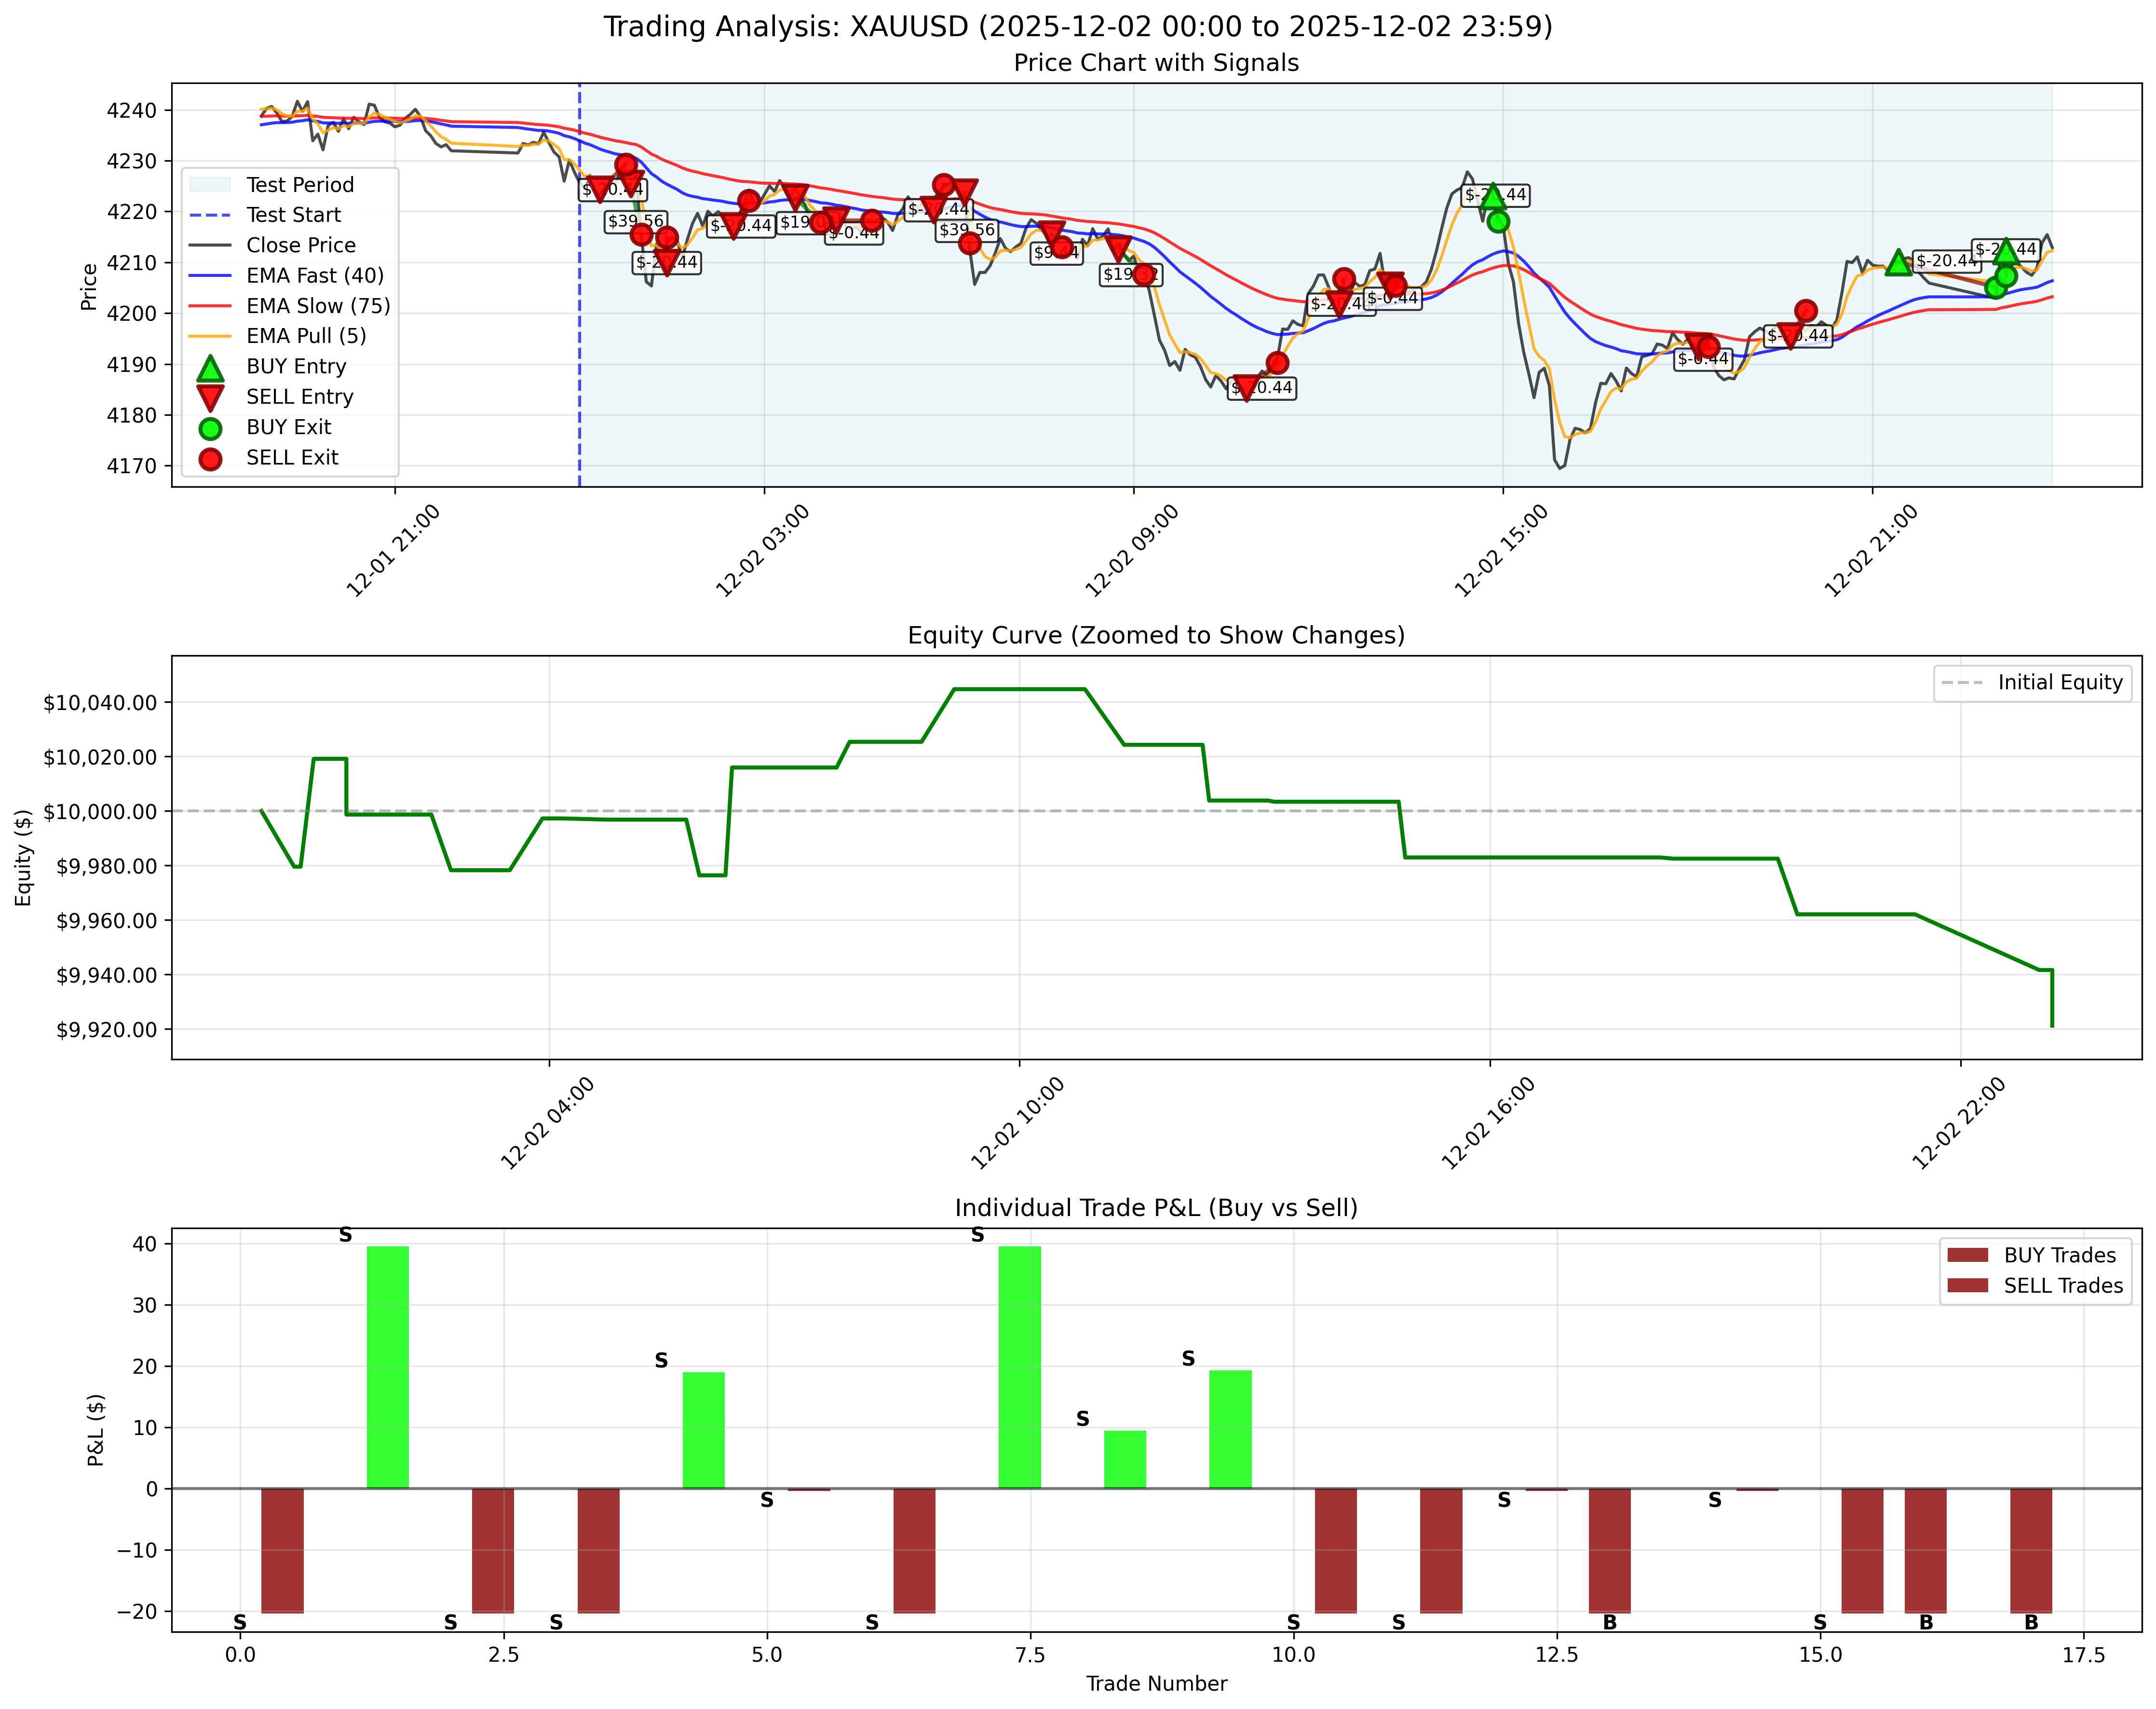
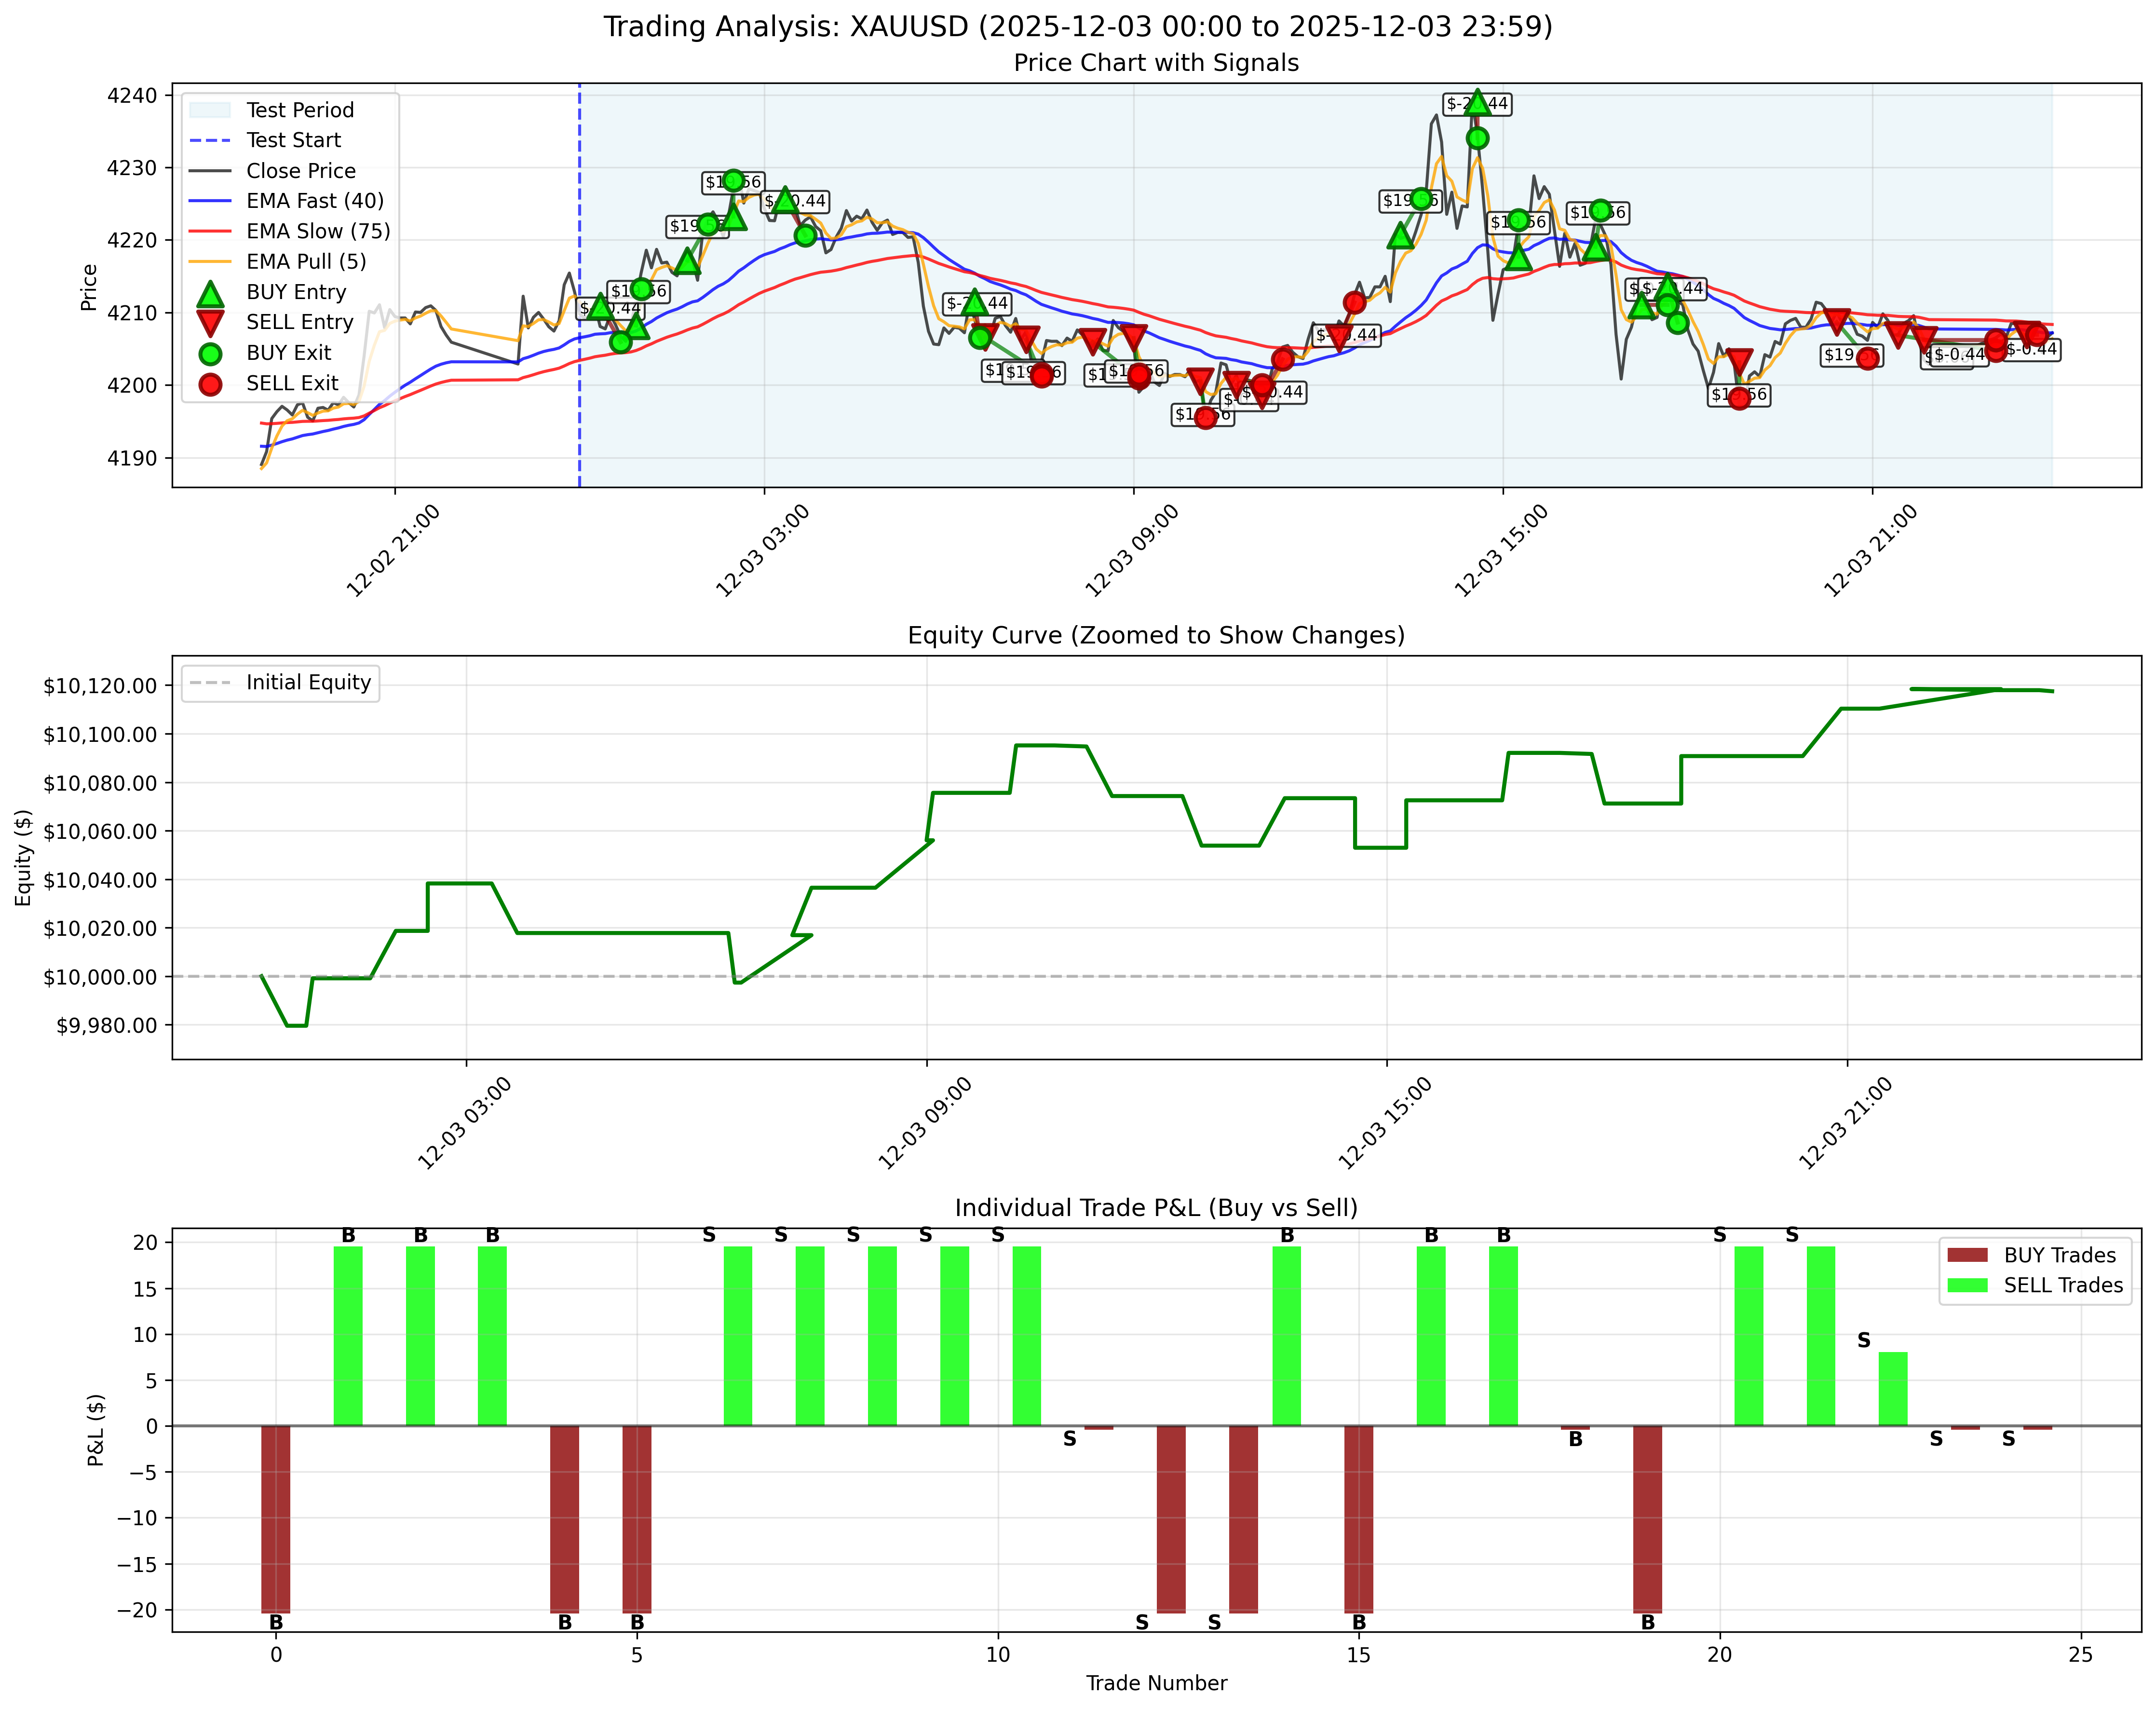
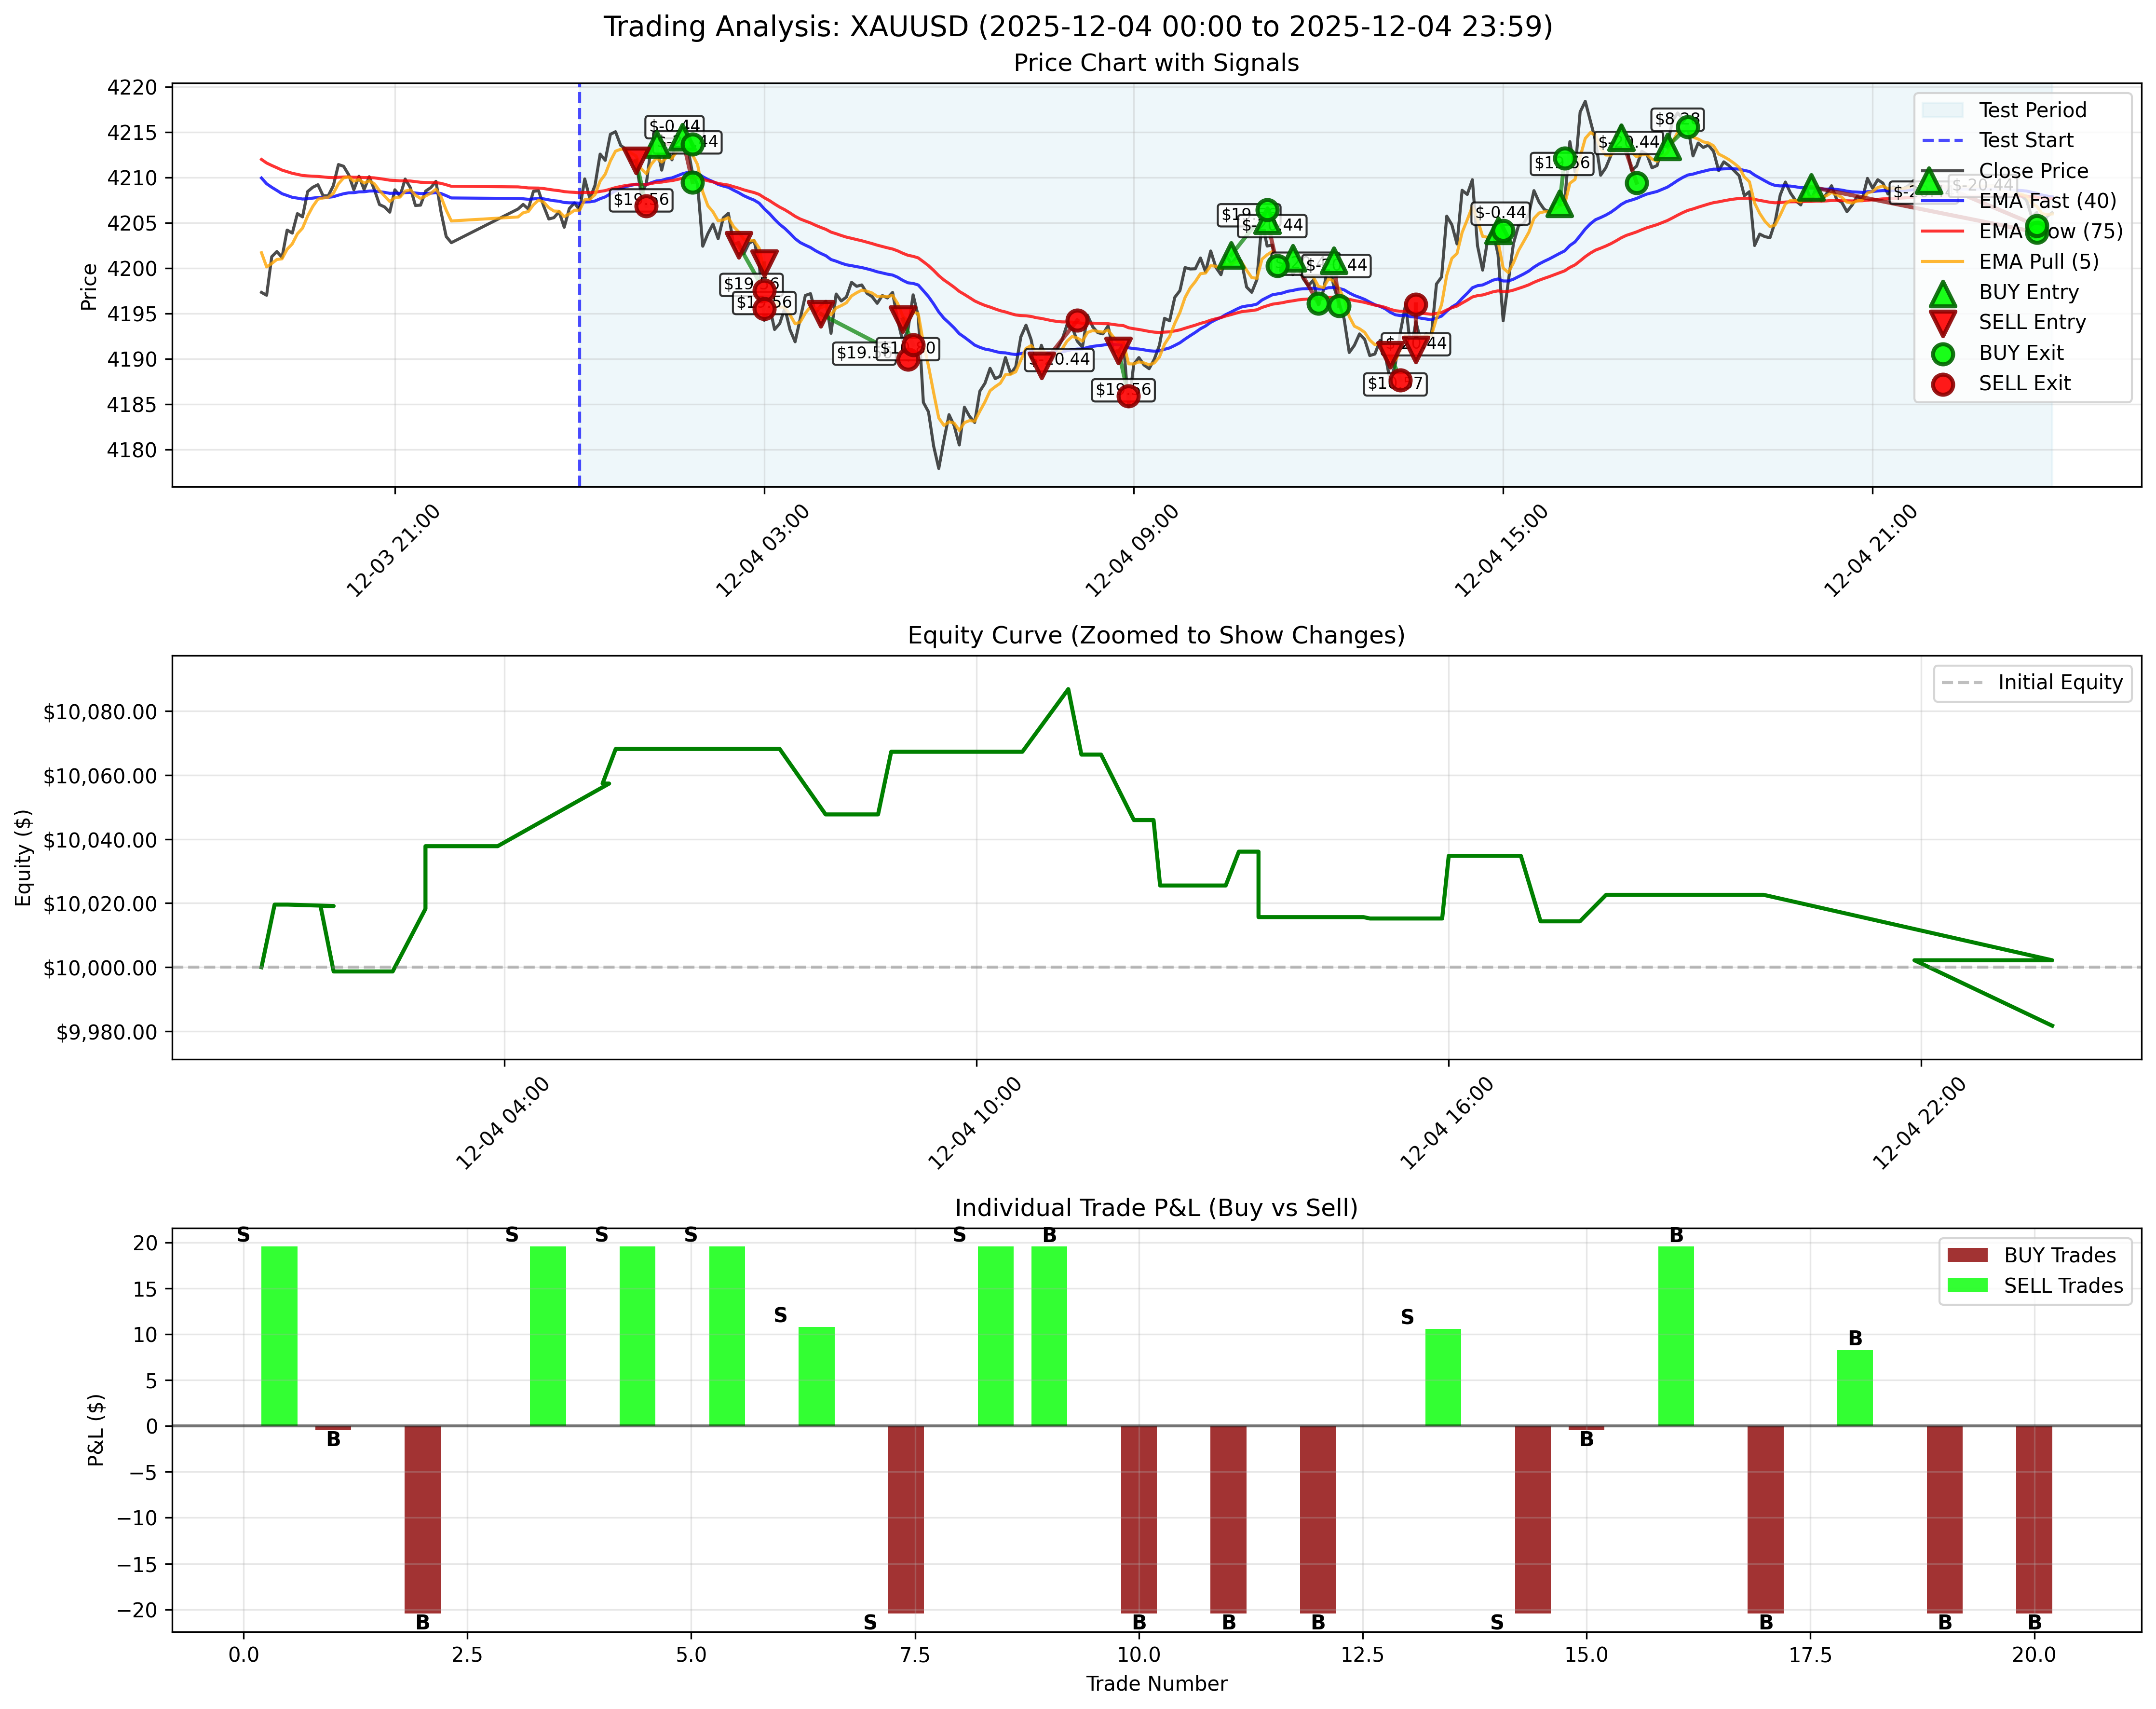
Complete daily backtest charts for all 23 trading days in December 2025. Each chart shows price action, entry/exit signals, and trade performance.
2025年12月の全23取引日の完全な日次バックテストチャート。各チャートは価格動向、エントリー/エグジットシグナル、取引パフォーマンスを示します。
December 1, 2025 / 2025年12月1日
December 2, 2025 / 2025年12月2日
December 3, 2025 - High Profit Day / 2025年12月3日 - 高利益日
December 4, 2025 / 2025年12月4日
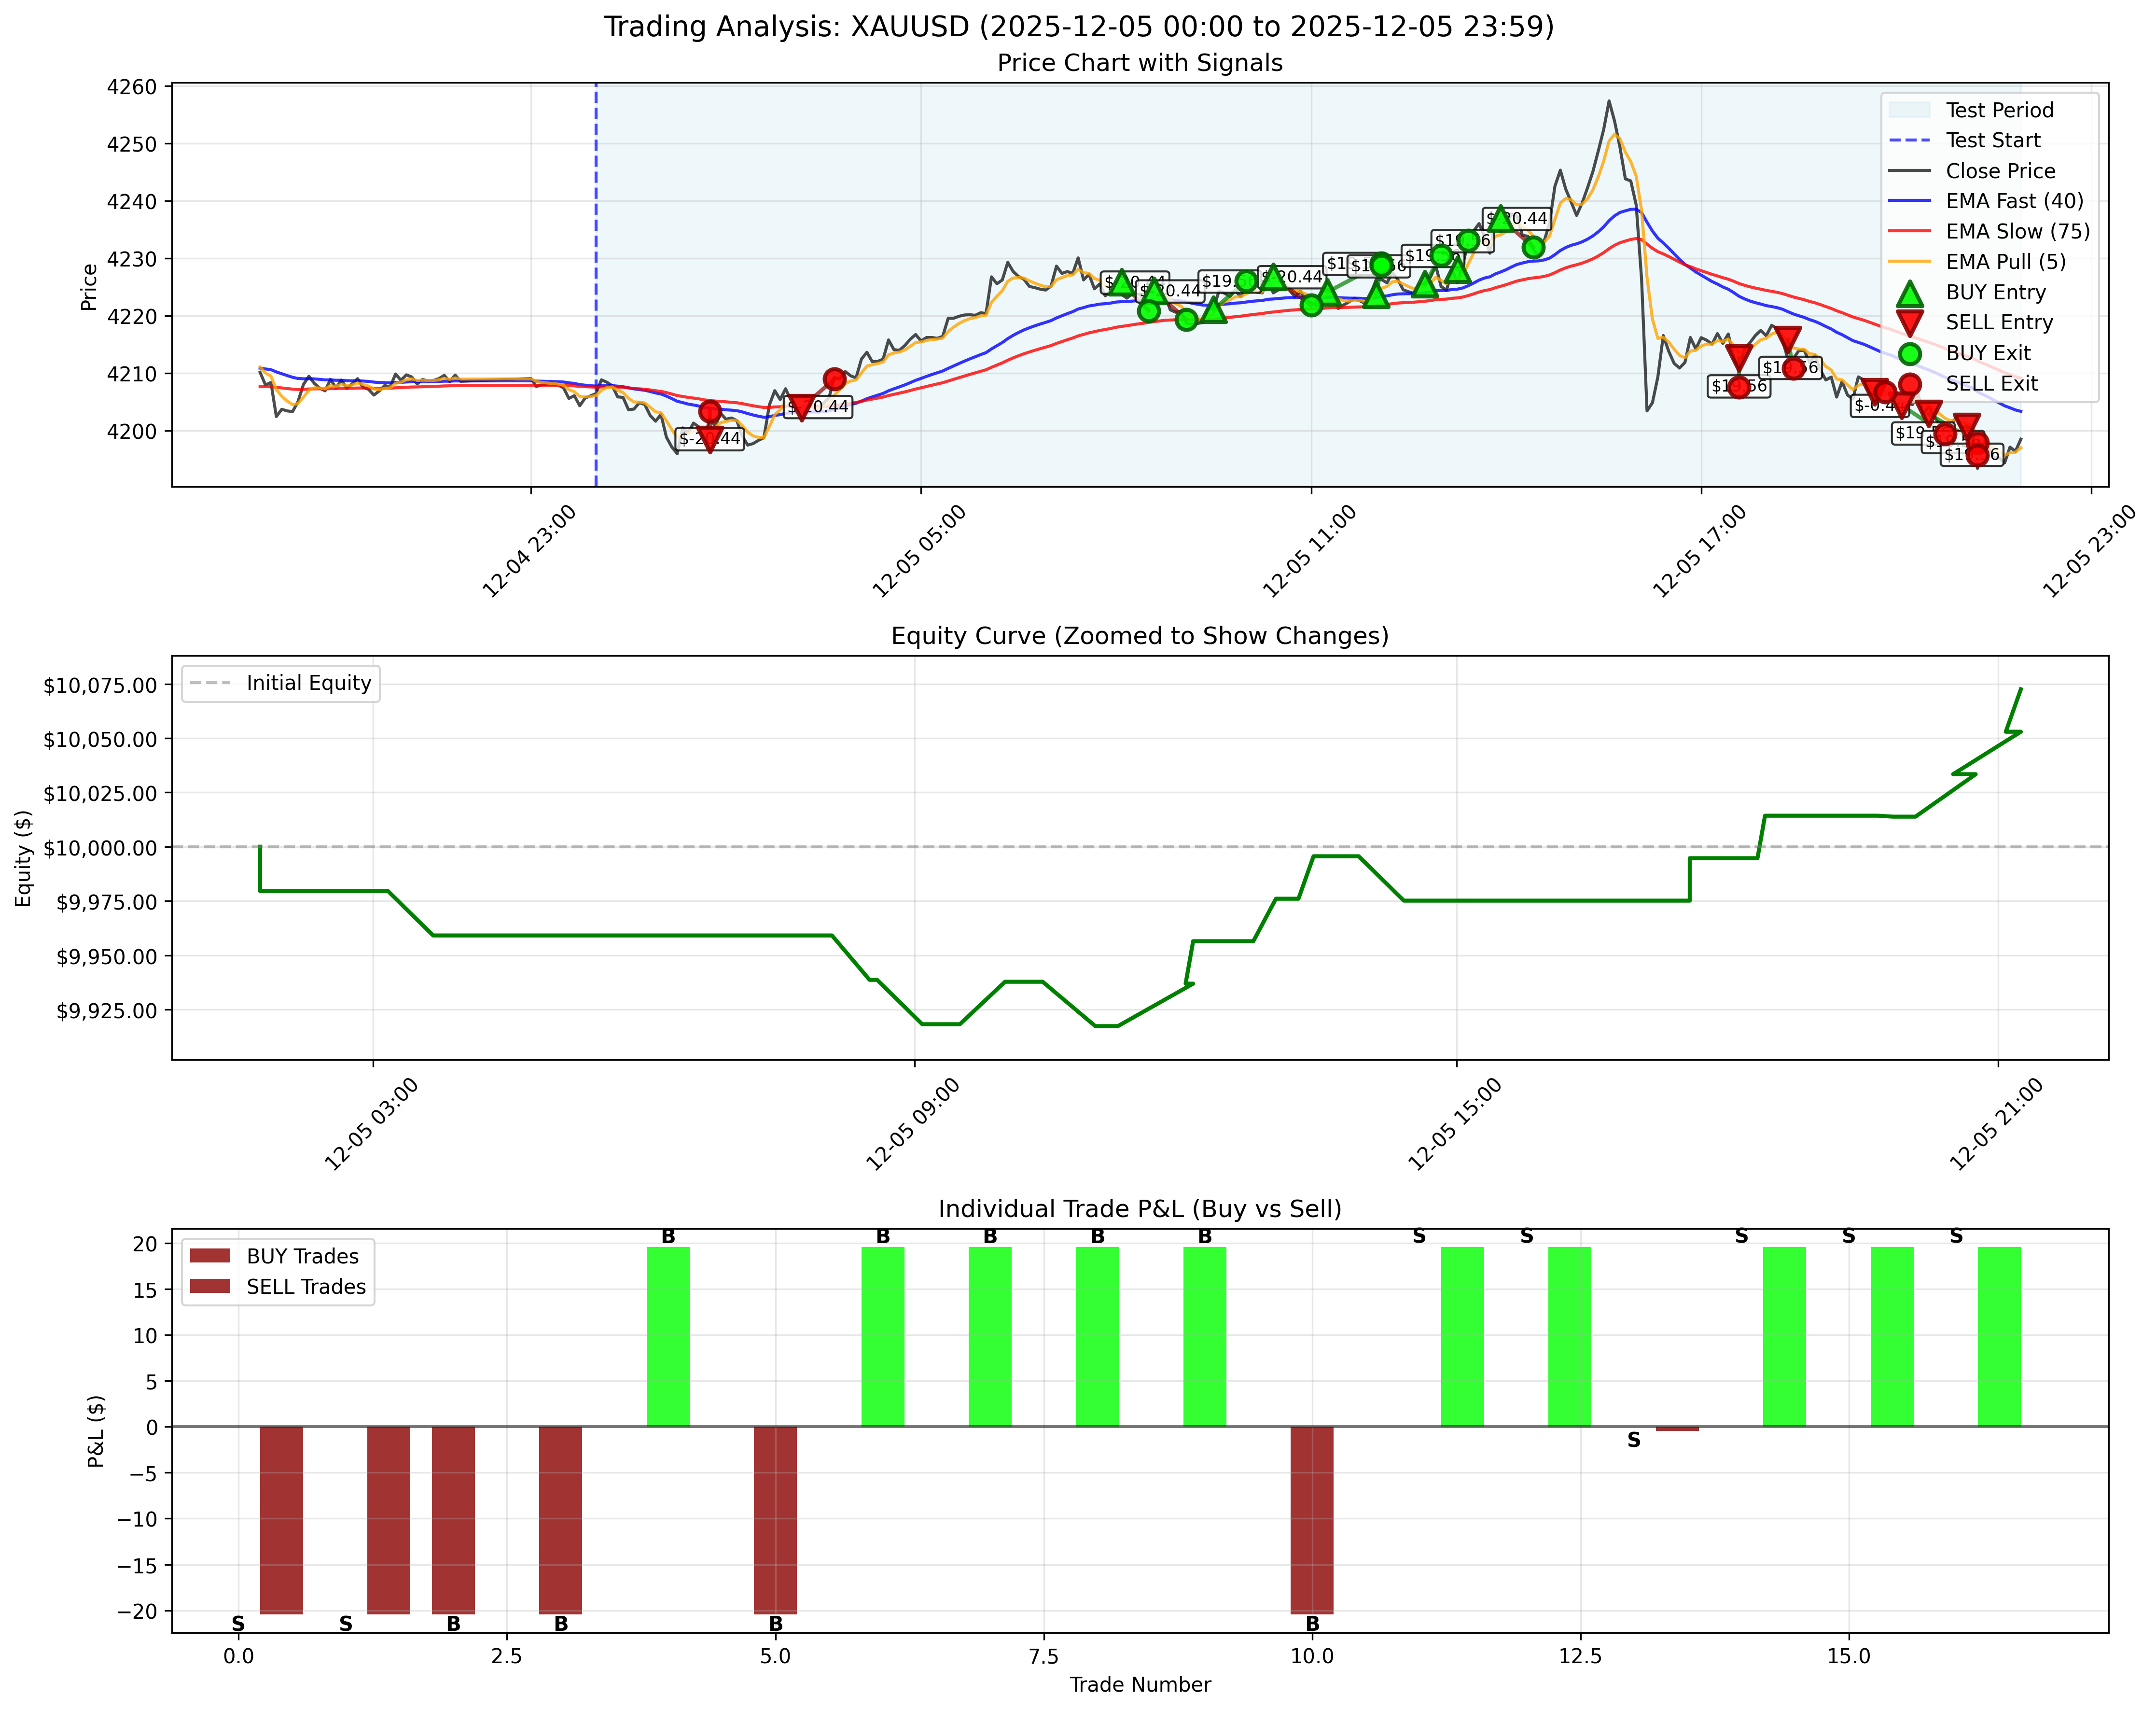
December 5, 2025 / 2025年12月5日
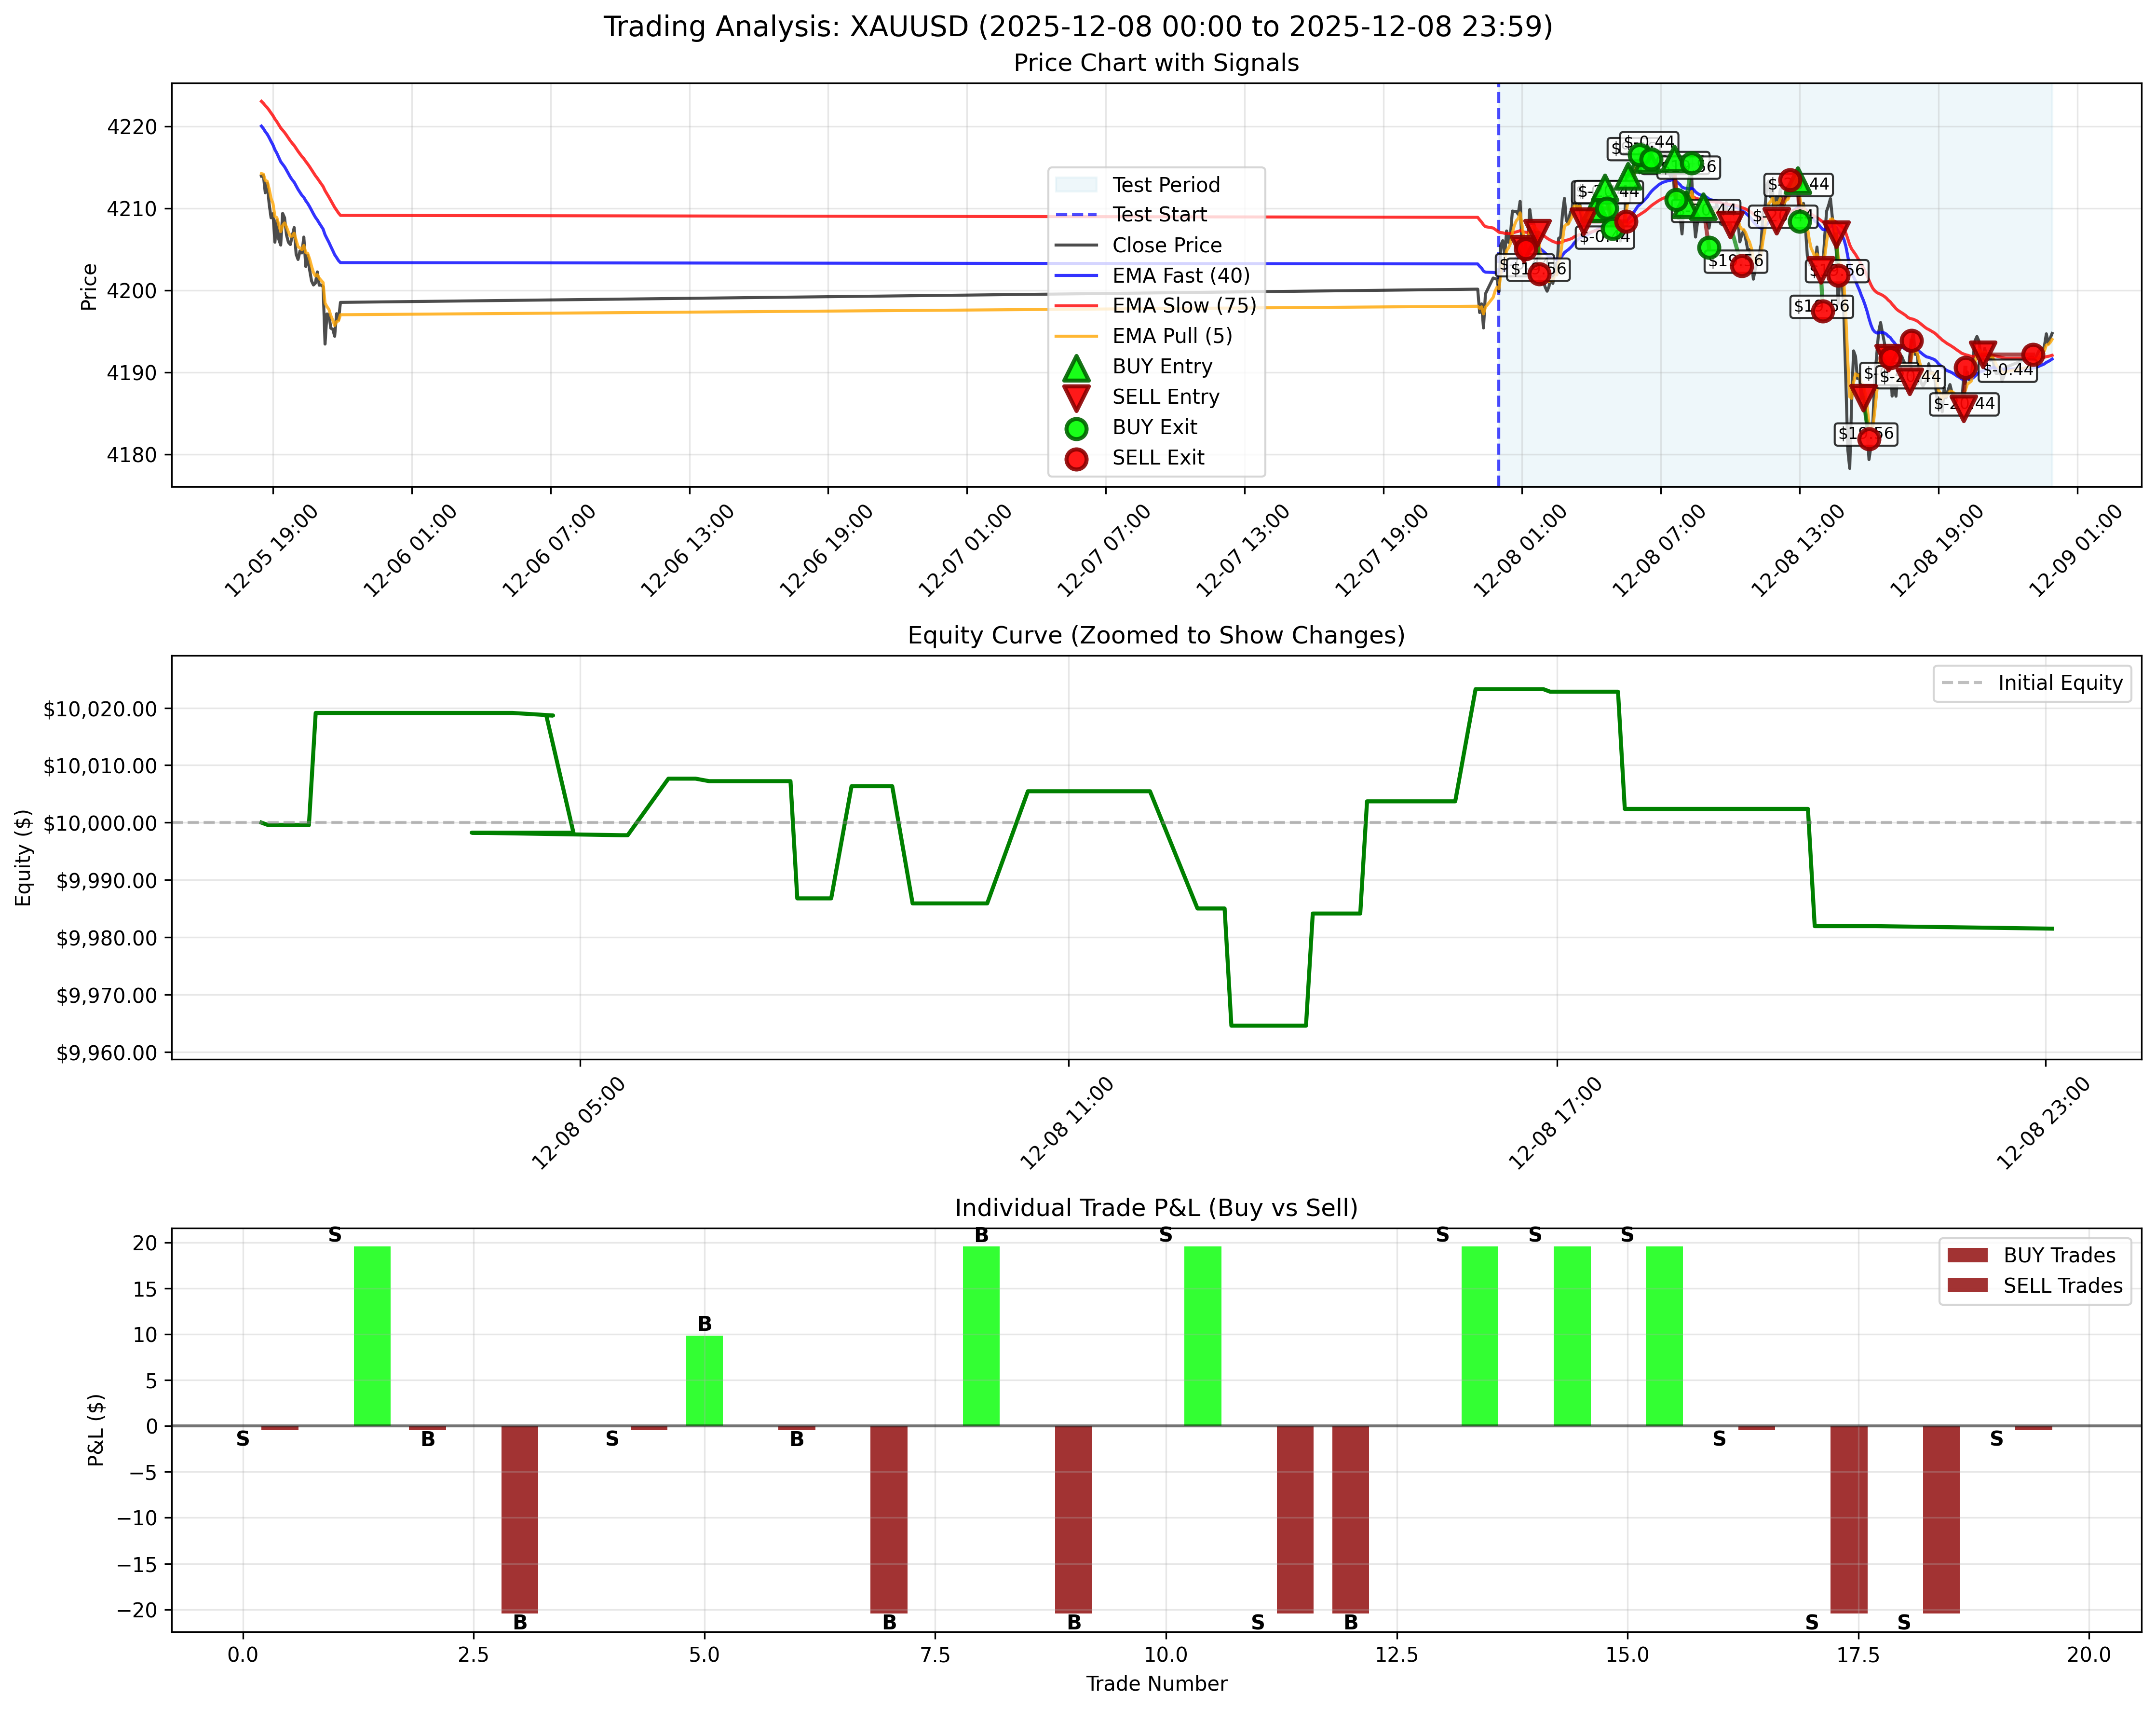
December 8, 2025 / 2025年12月8日
December 9, 2025 - Largest Loss Day / 2025年12月9日 - 最大損失日
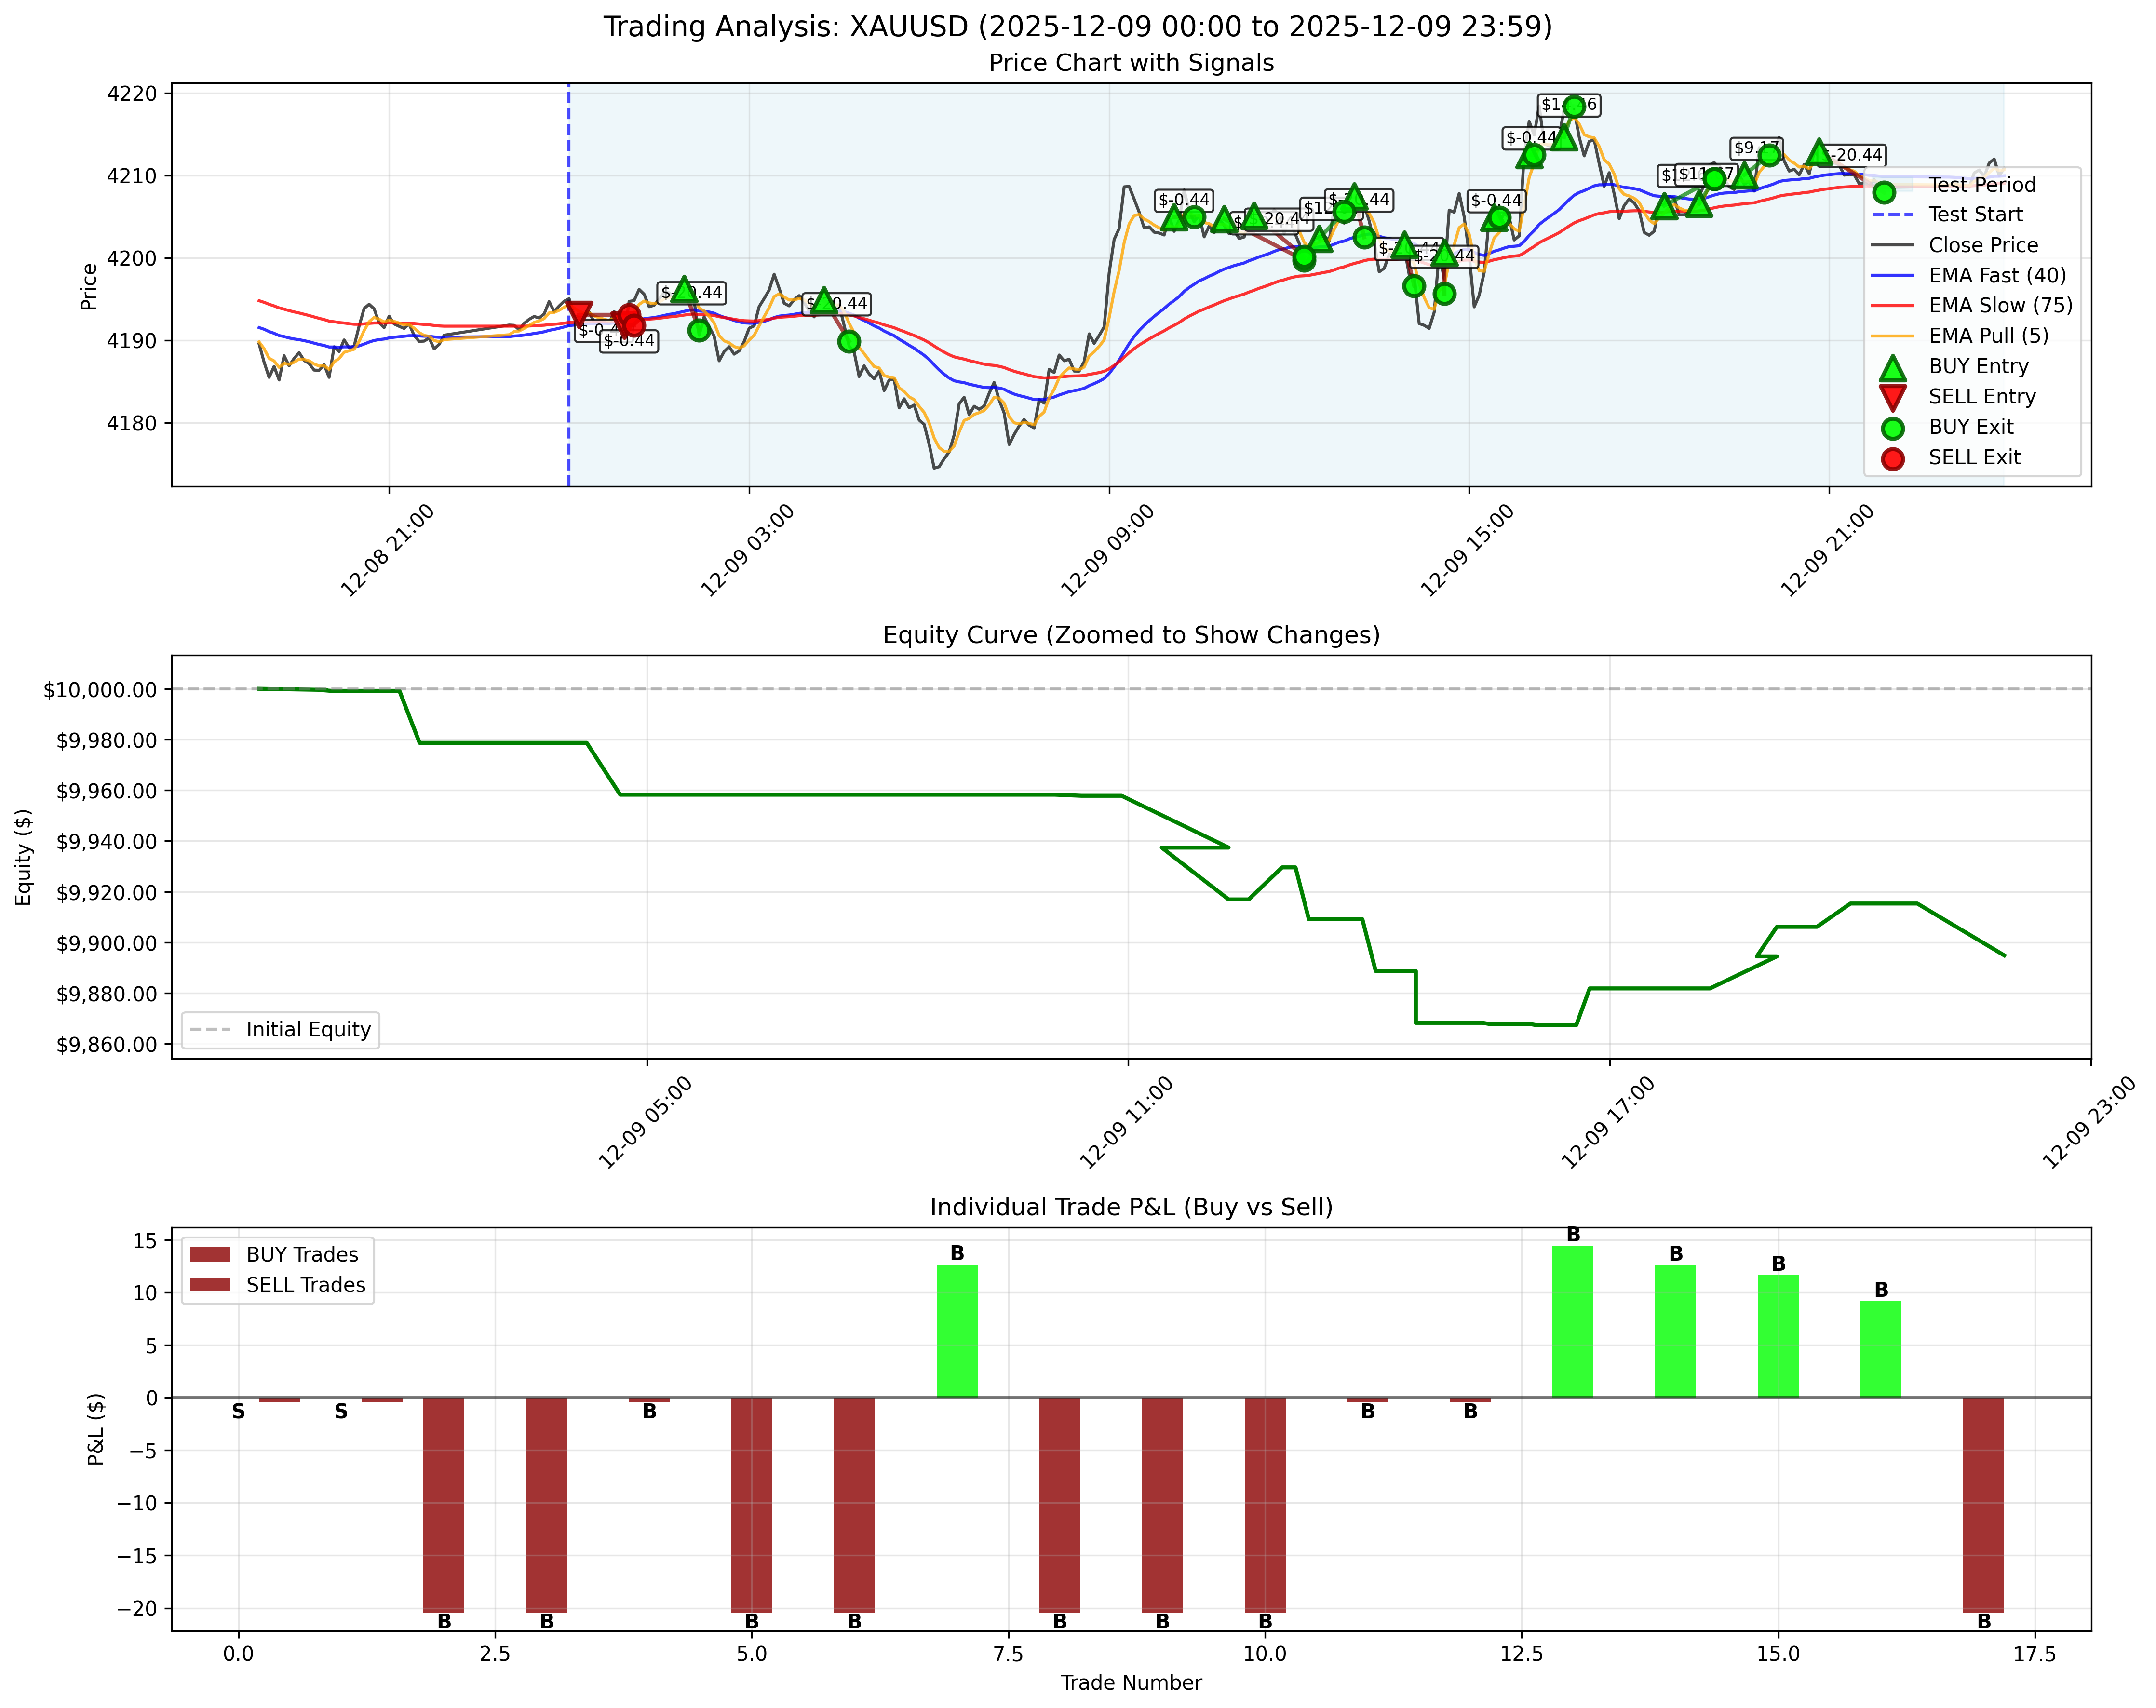
This day highlights the importance of enhanced risk management during volatile market conditions.
この日は、変動の激しい市場環境でのリスク管理強化の重要性を示しています。
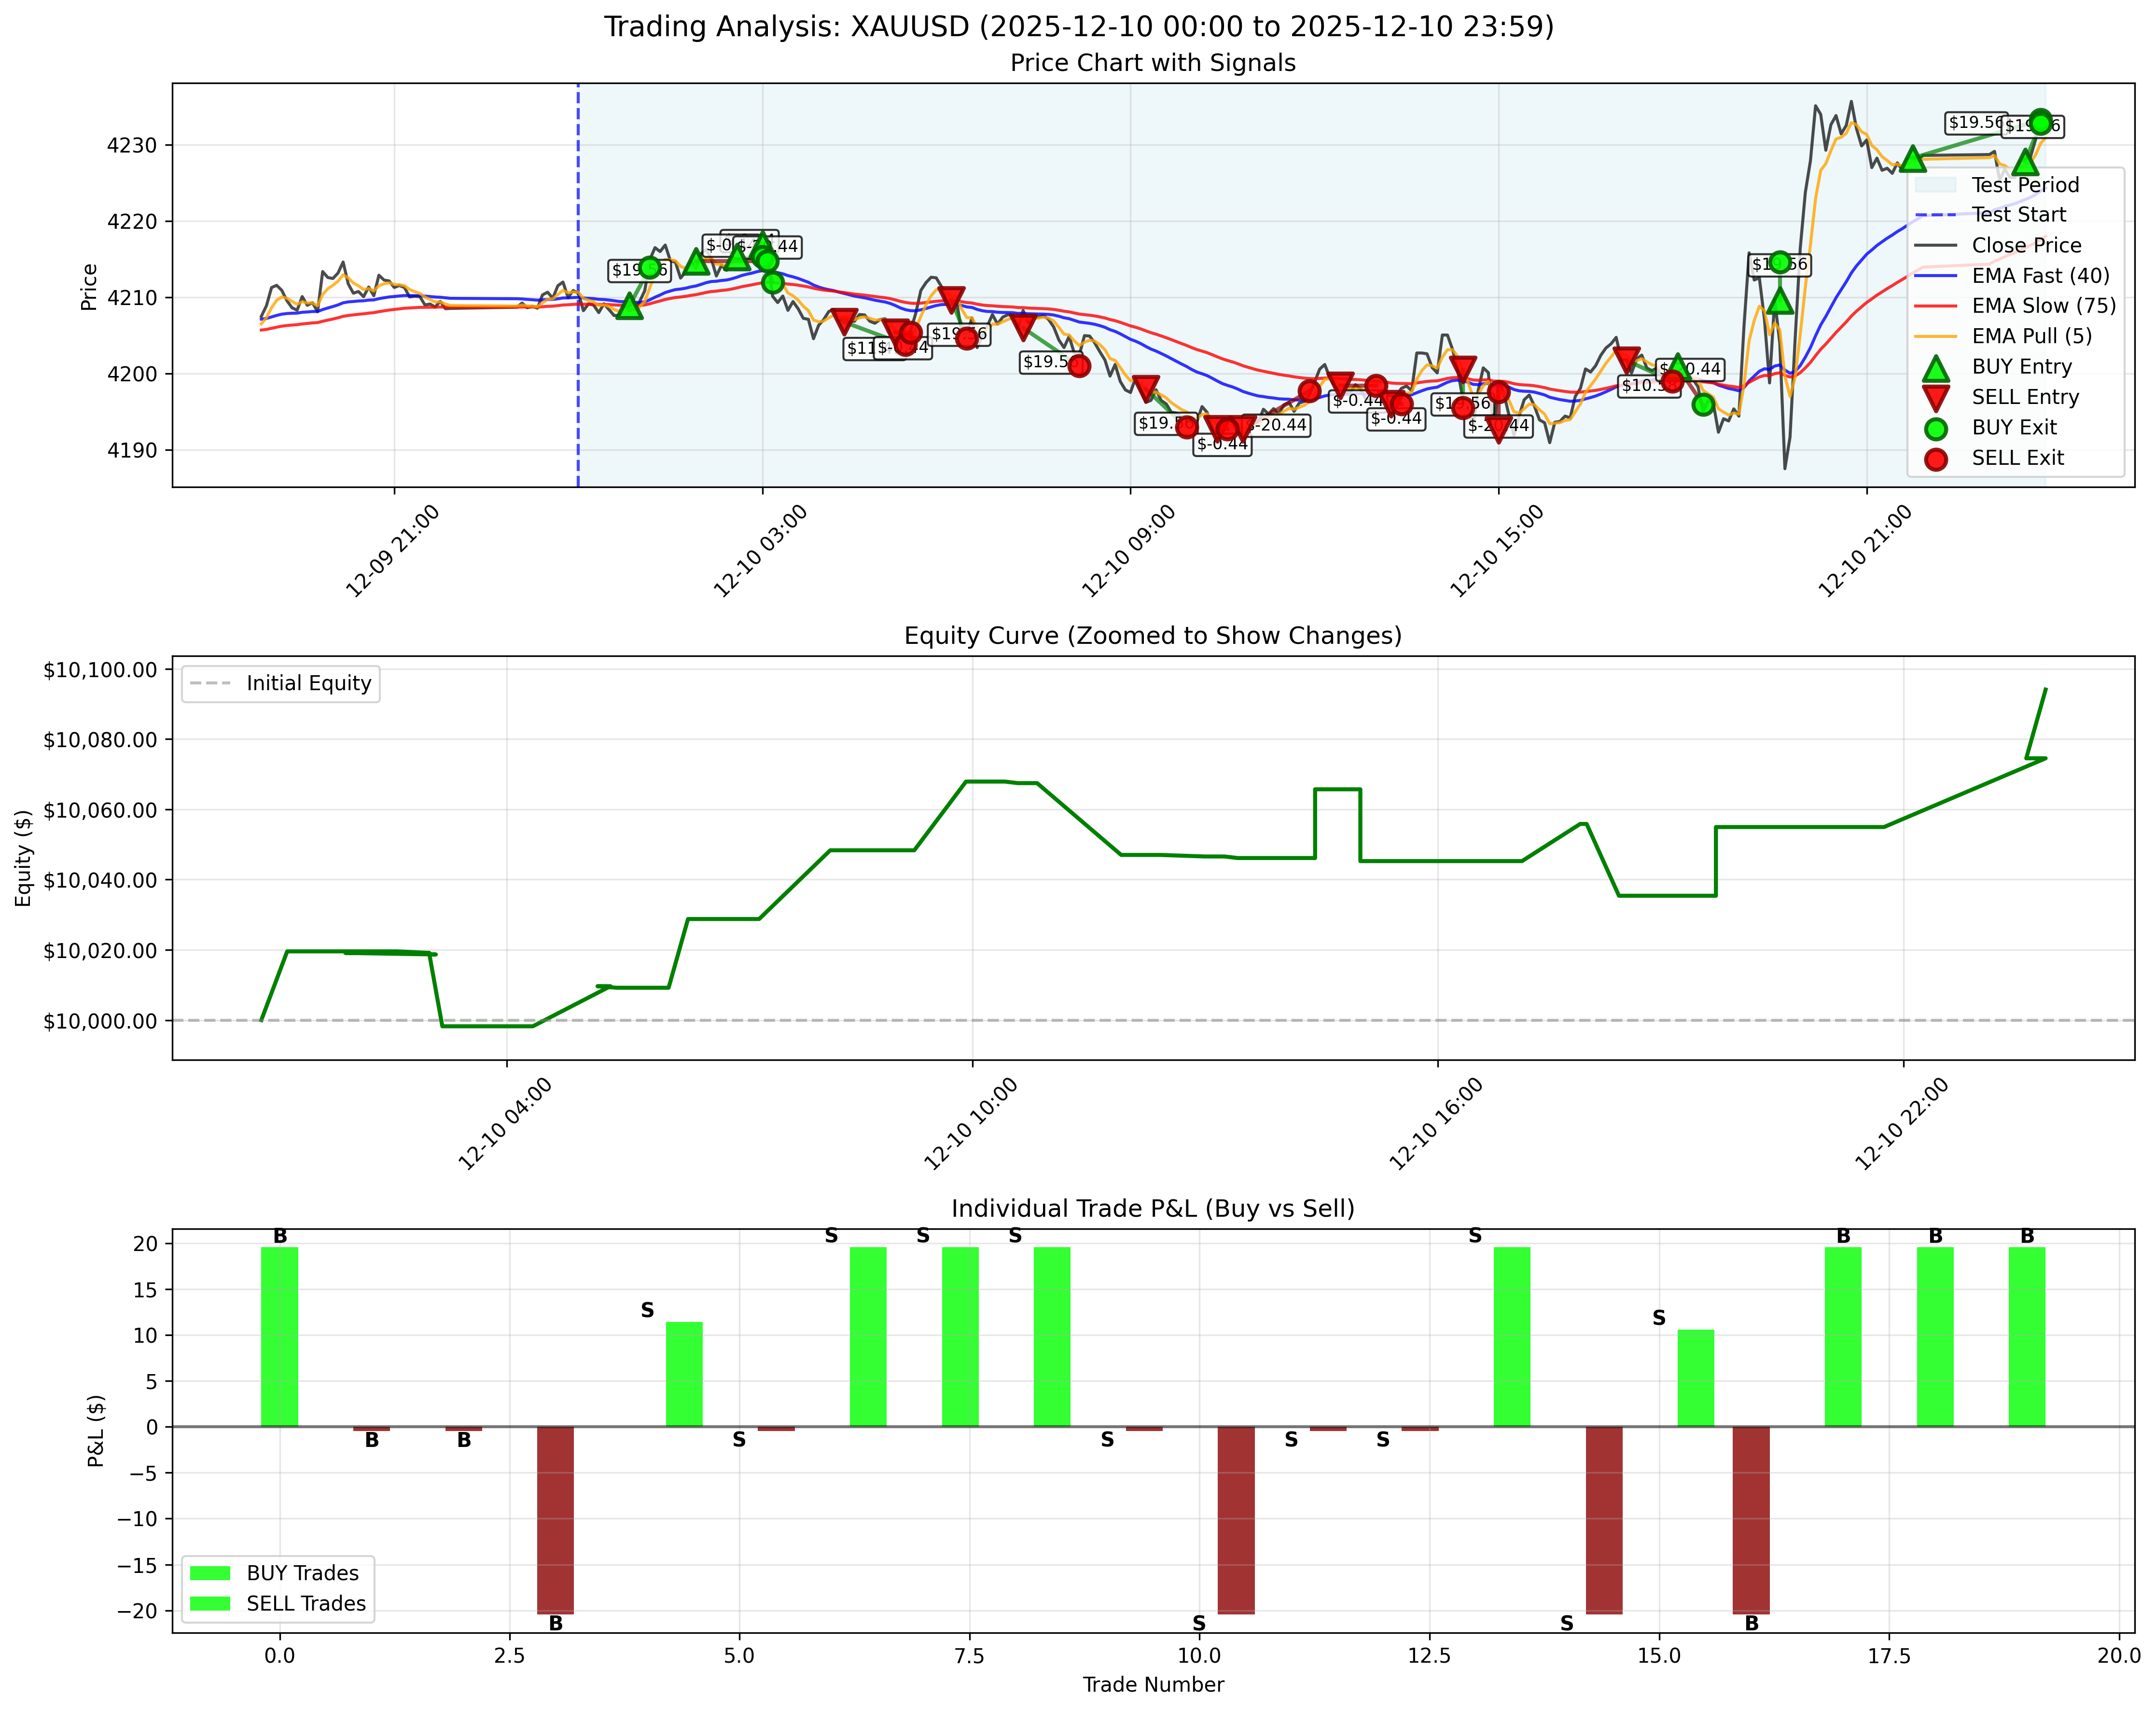
December 10, 2025 / 2025年12月10日
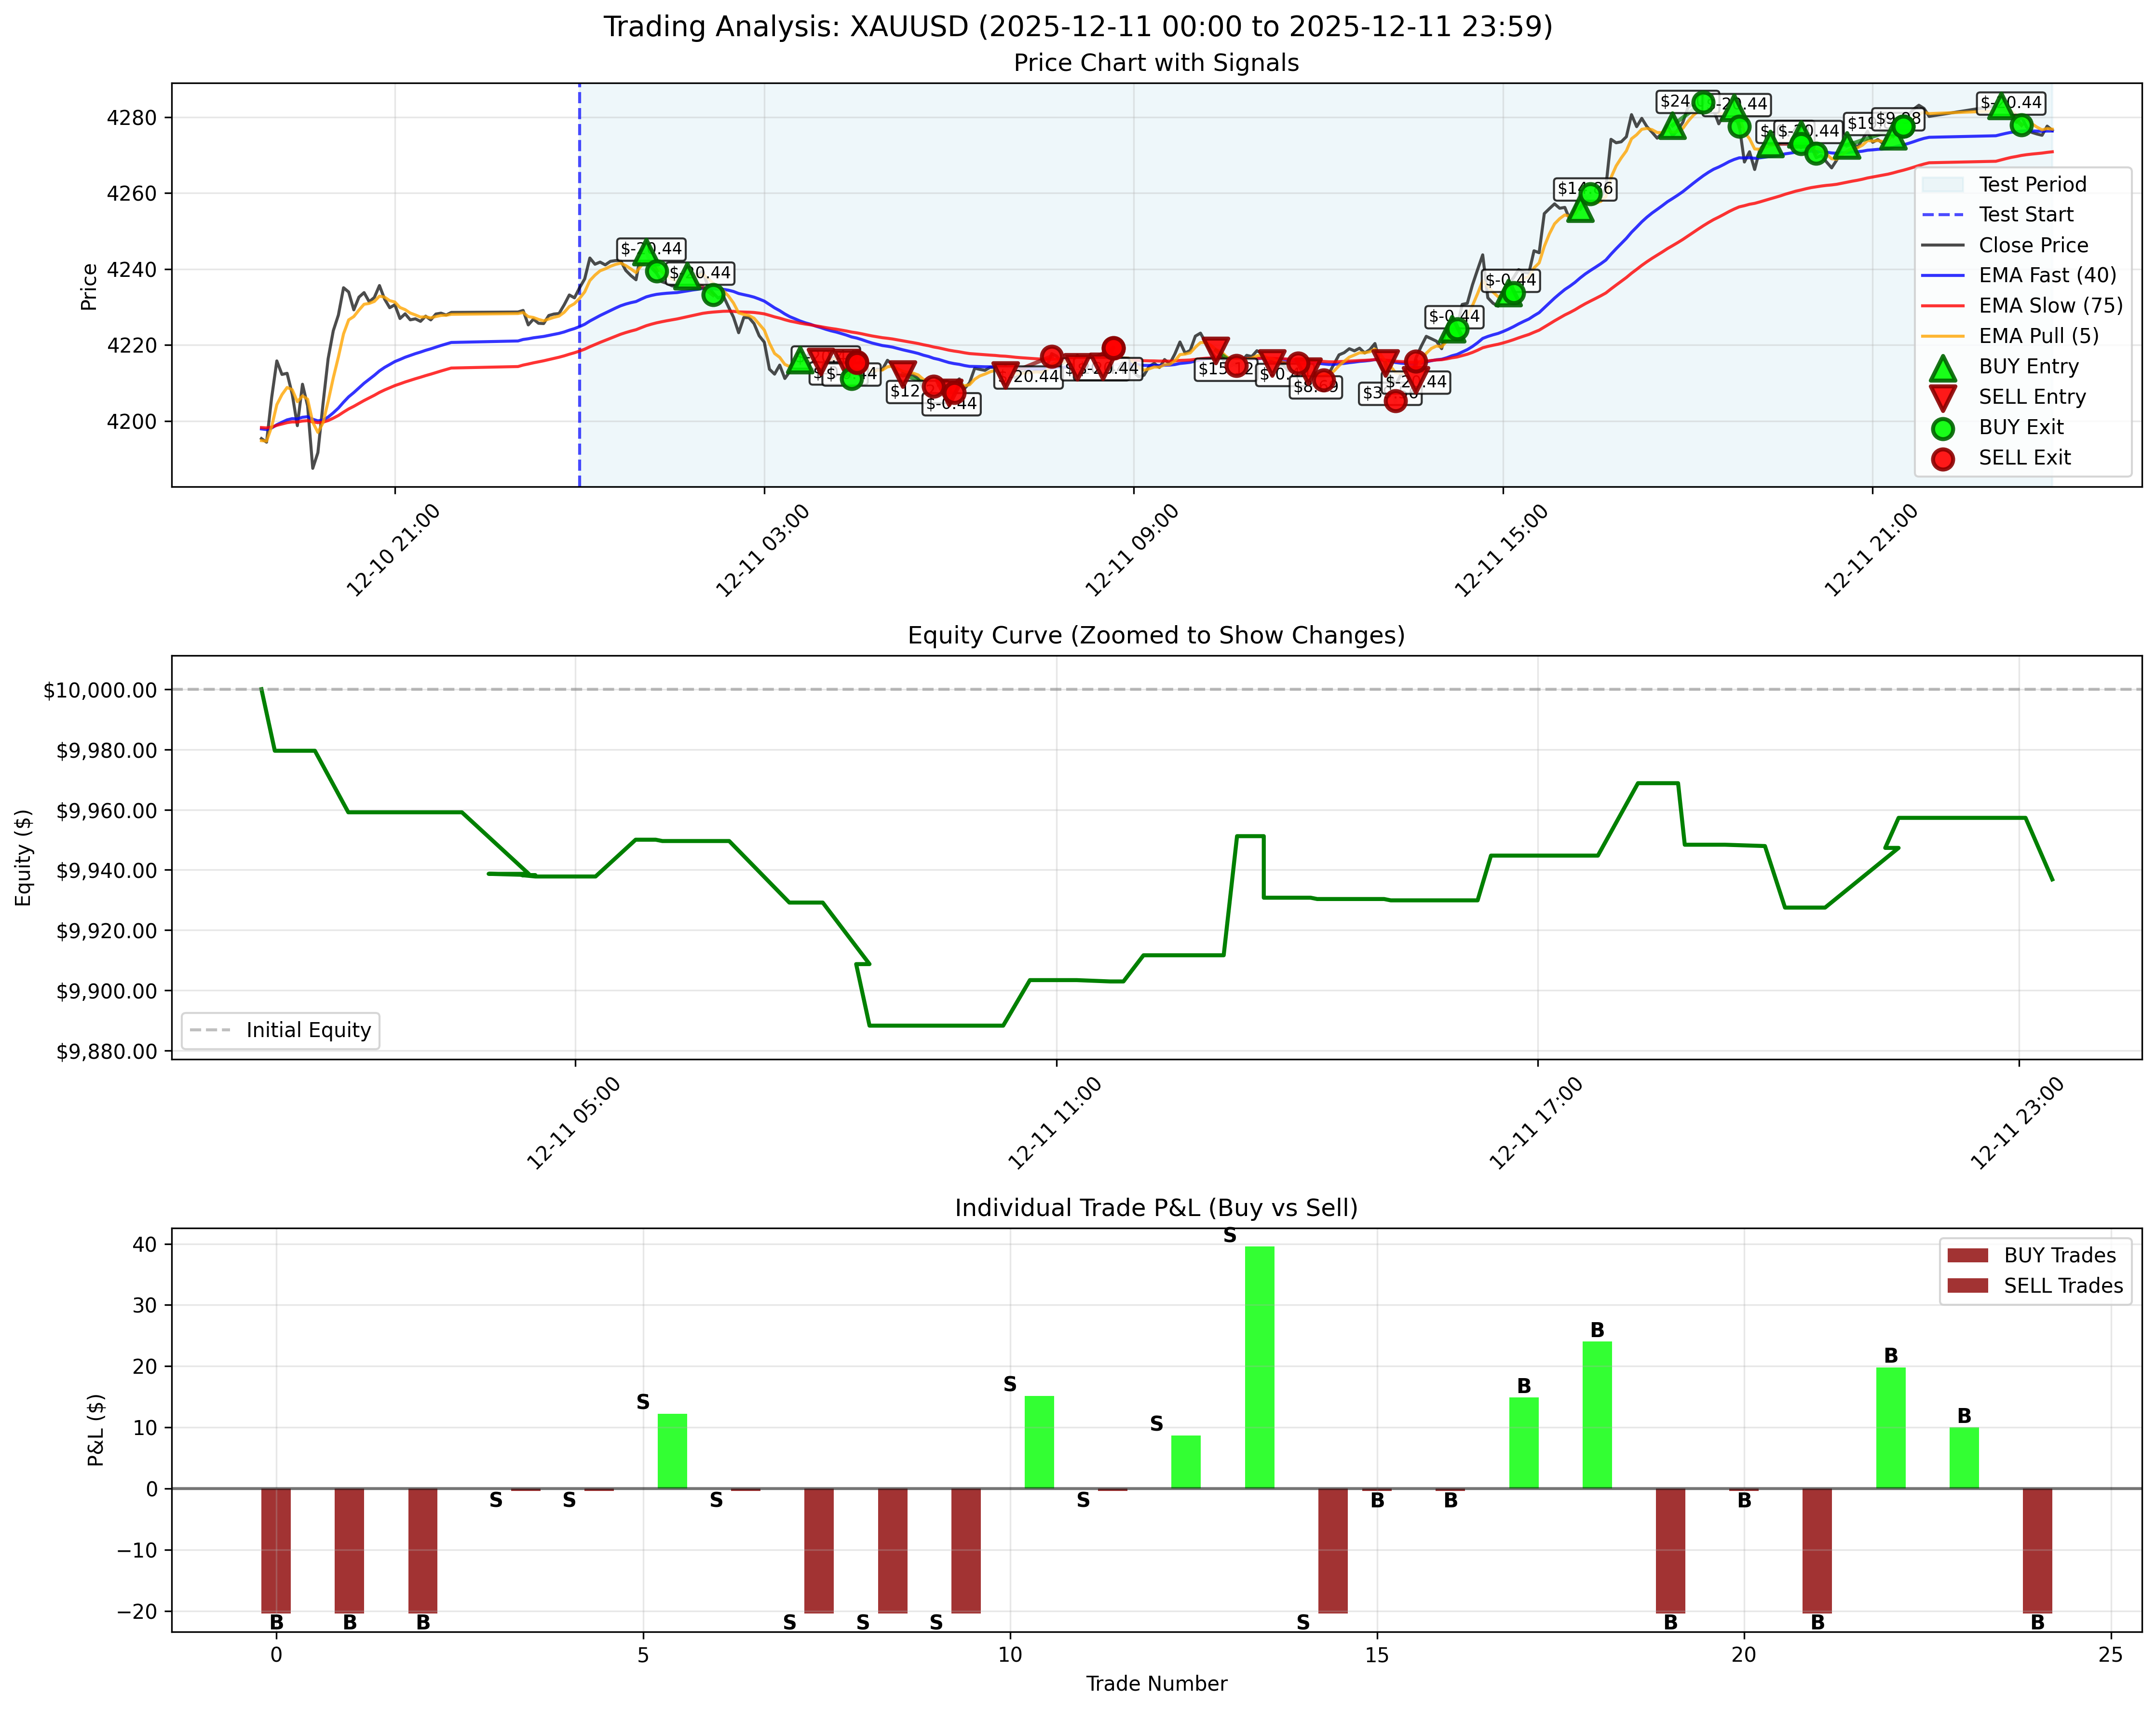
December 11, 2025 / 2025年12月11日
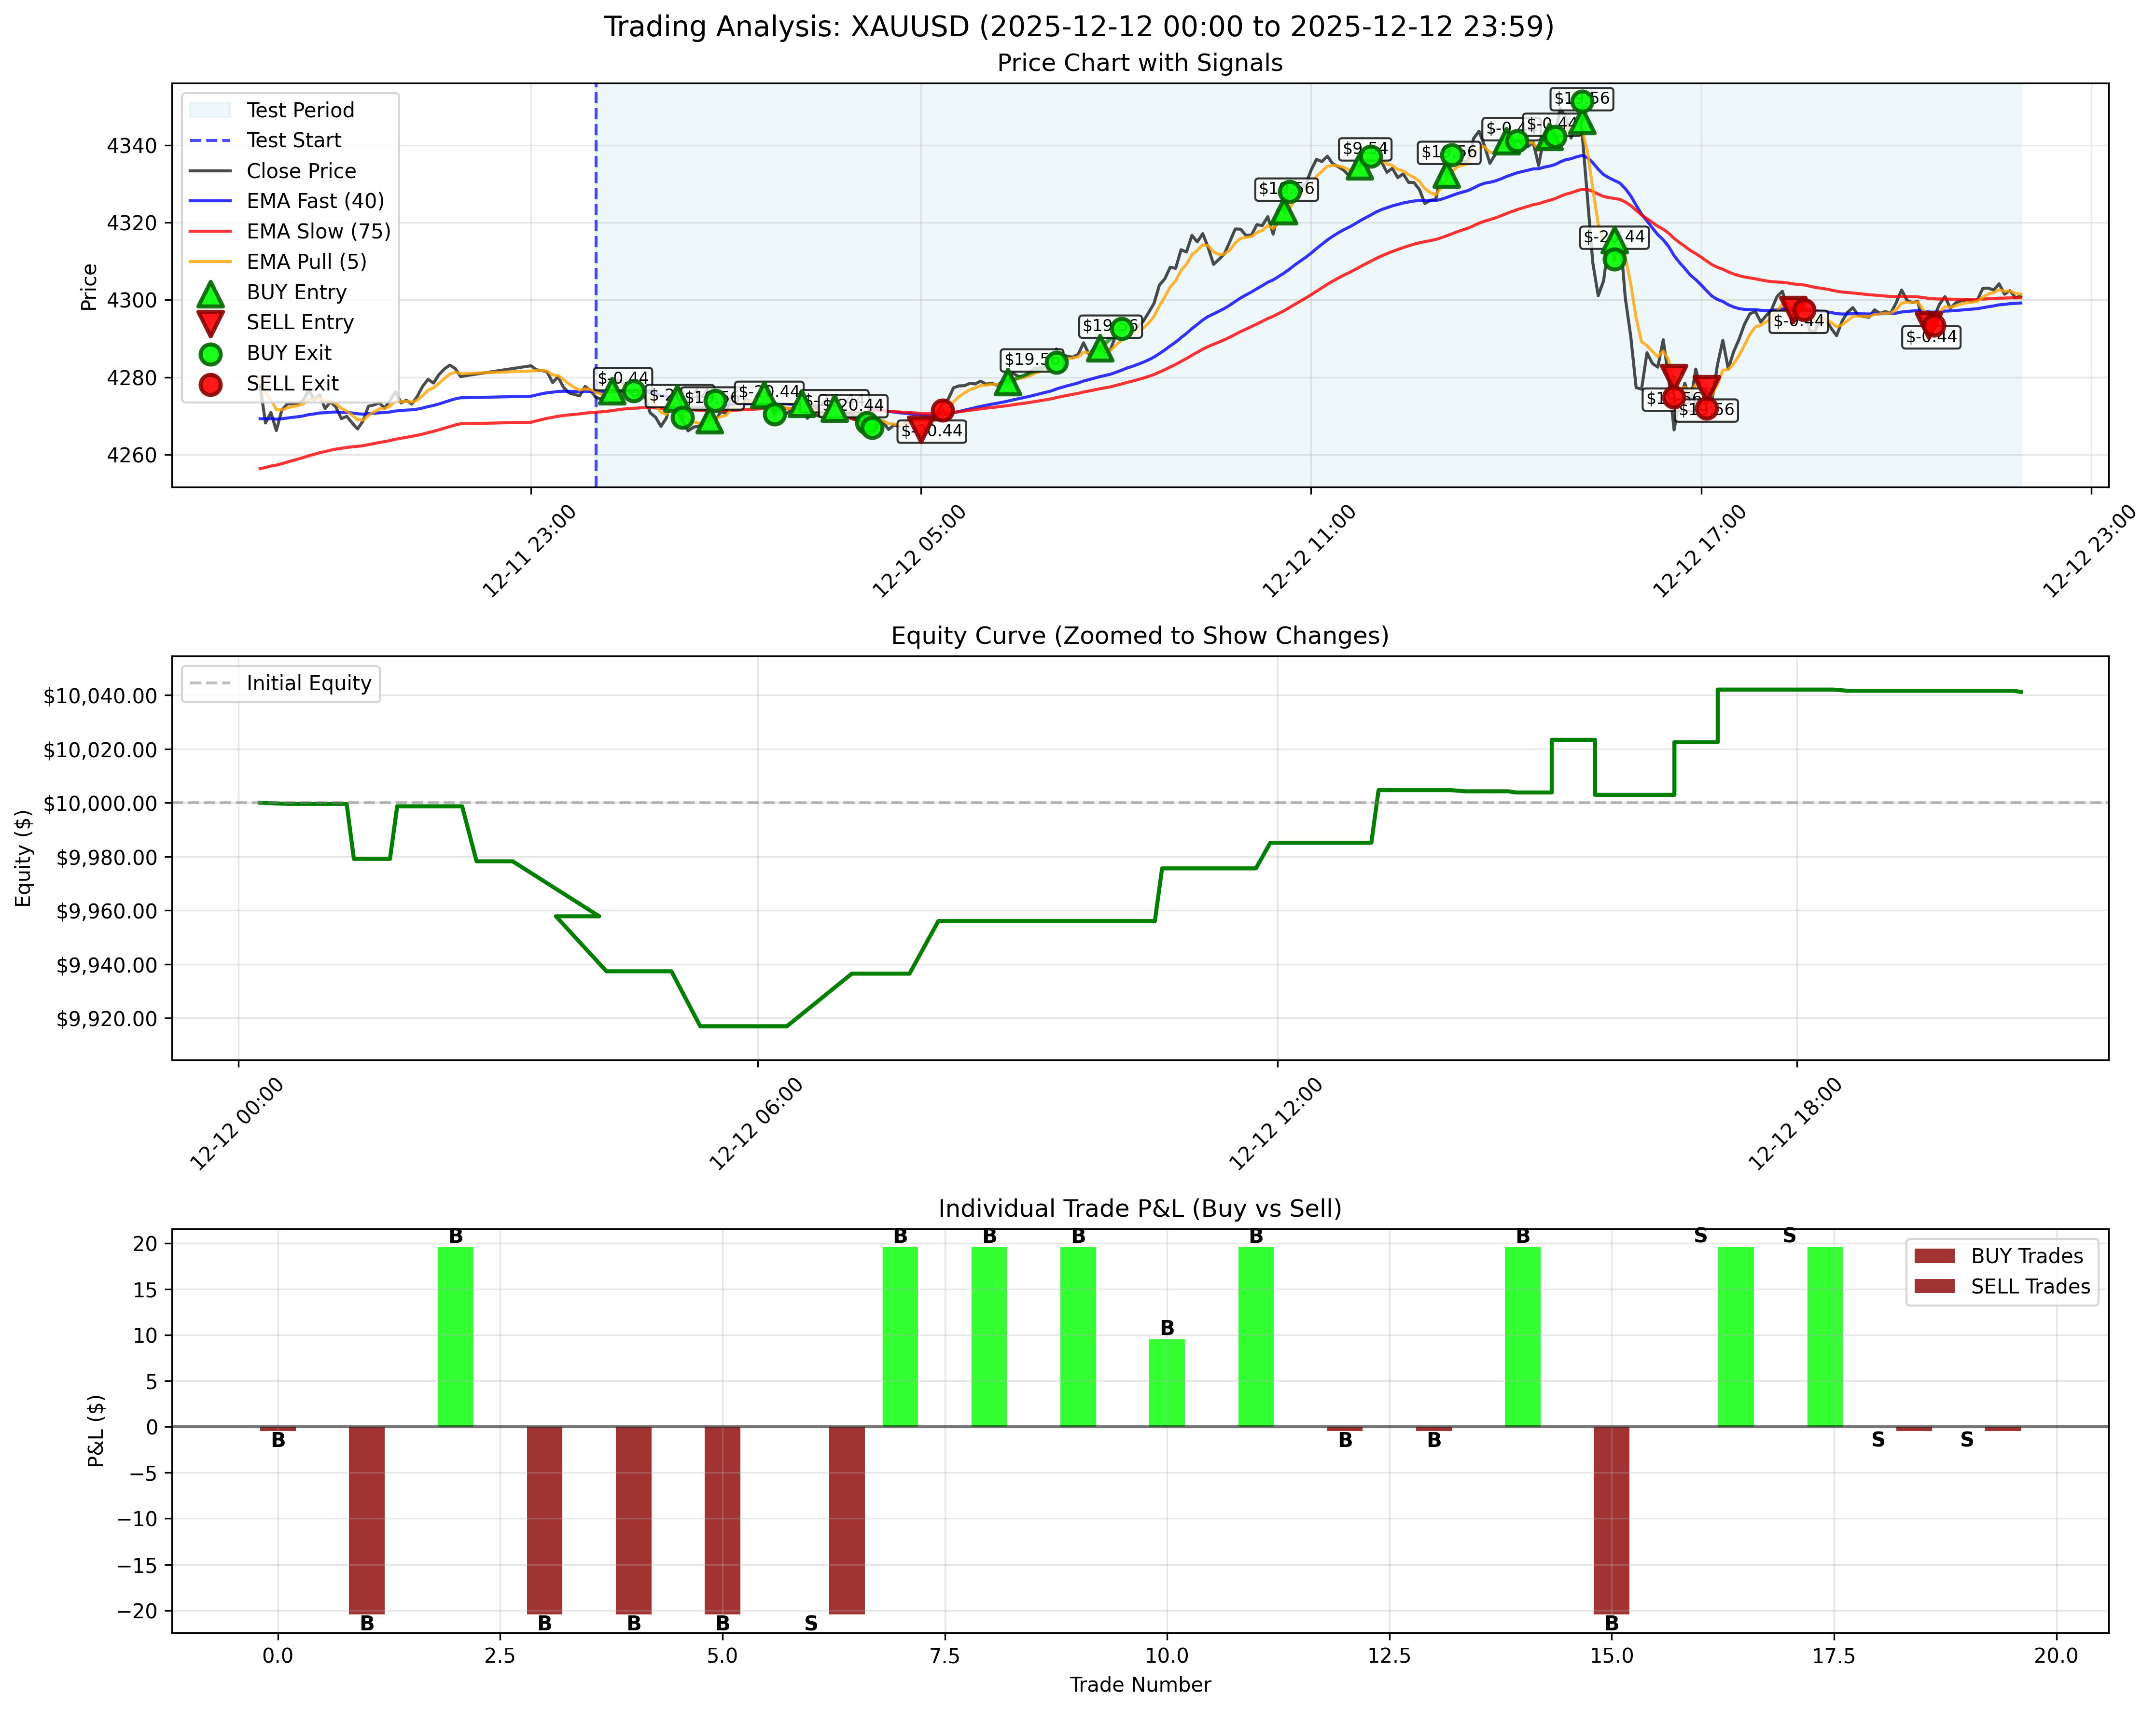
December 12, 2025 / 2025年12月12日
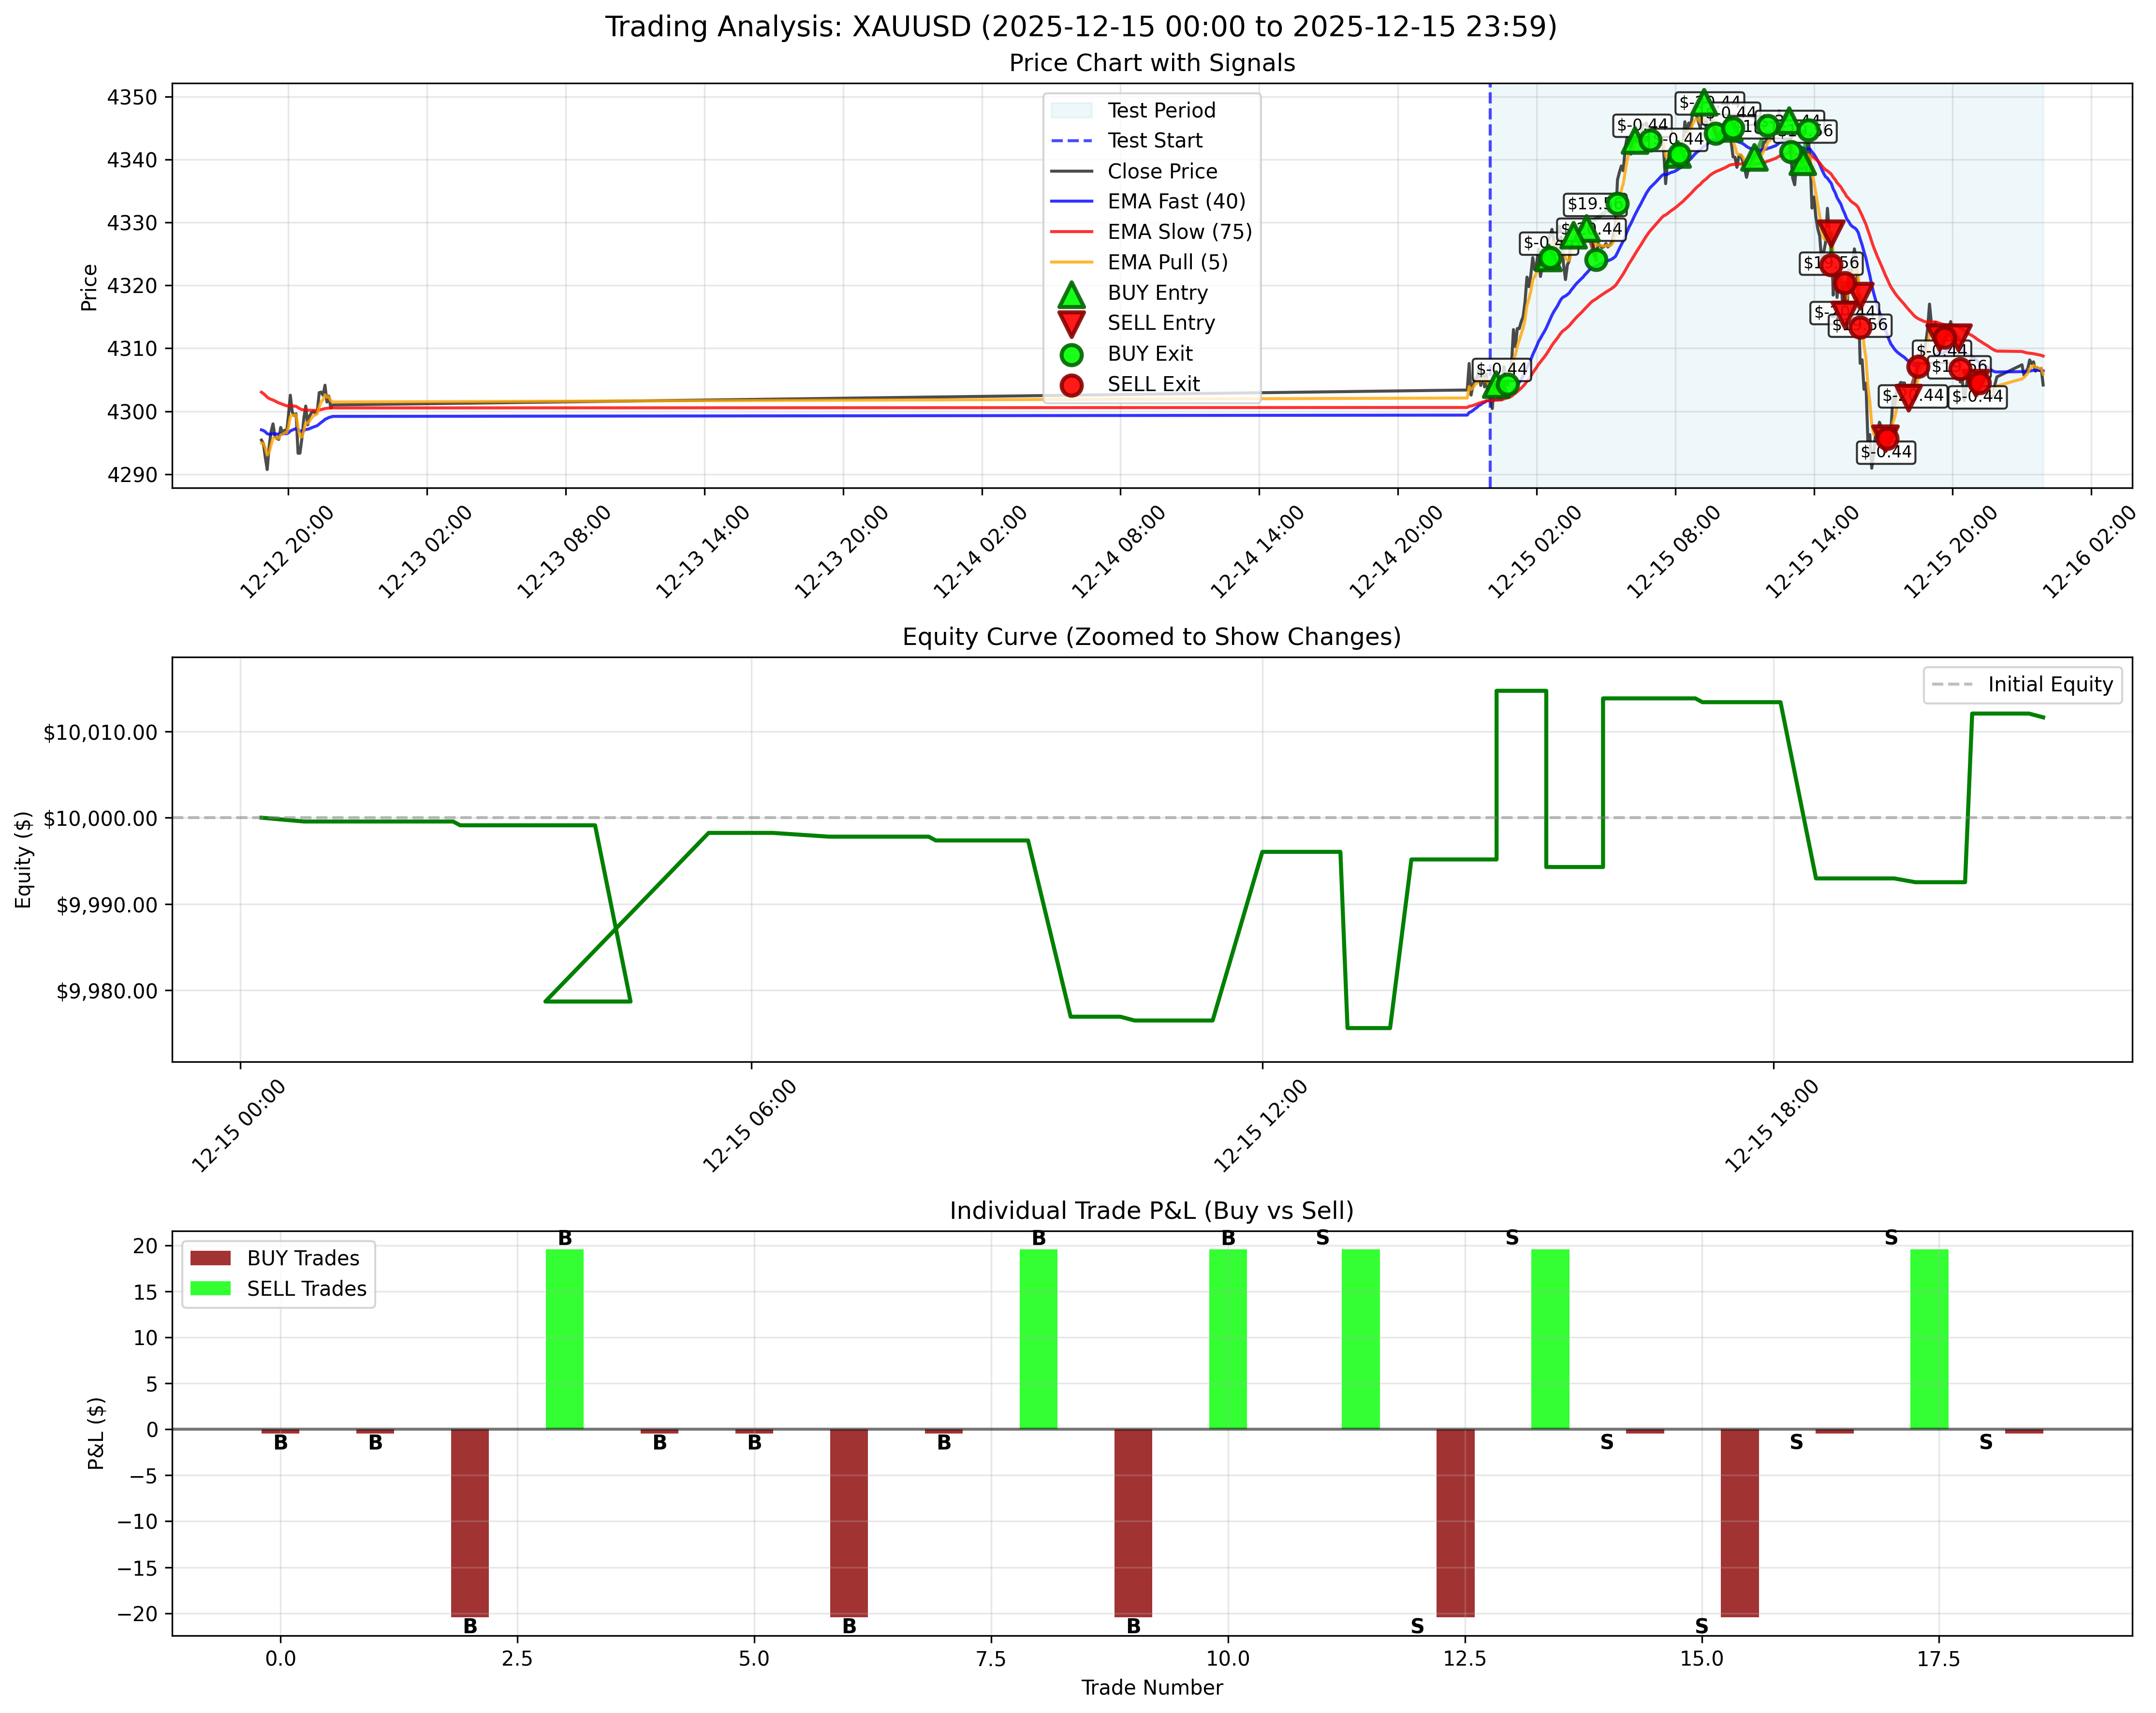
December 15, 2025 / 2025年12月15日
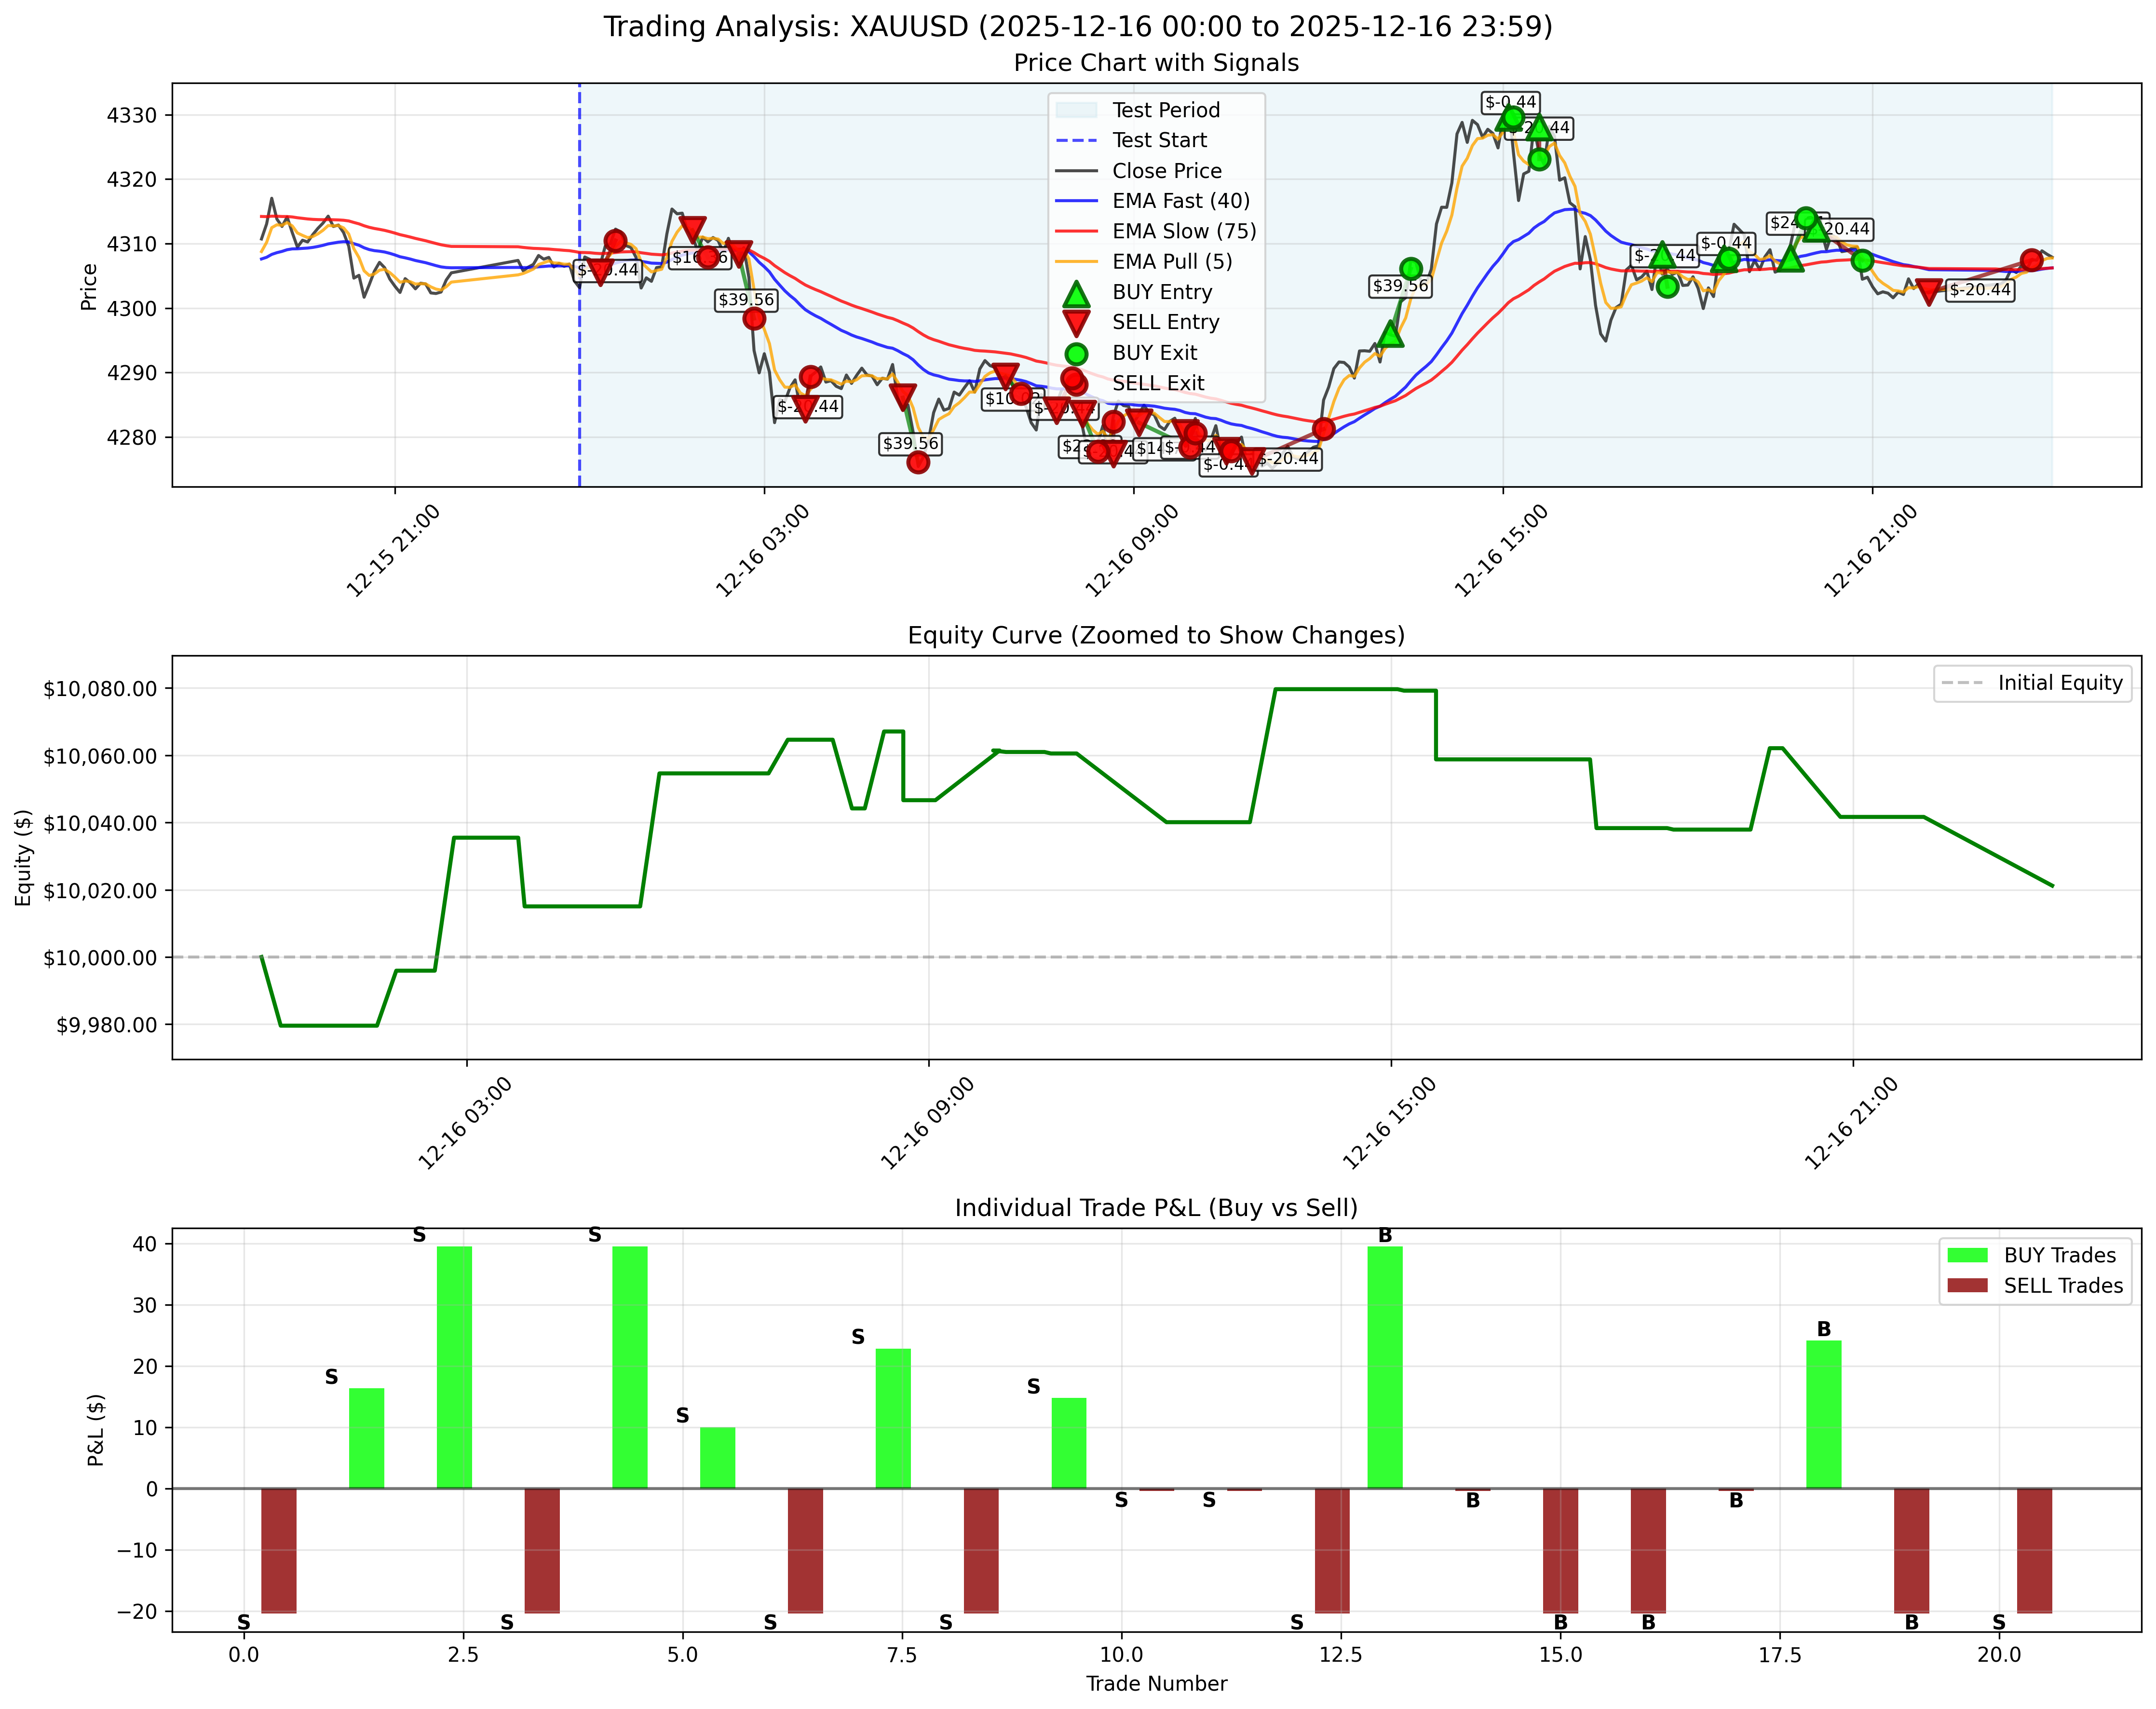
December 16, 2025 / 2025年12月16日
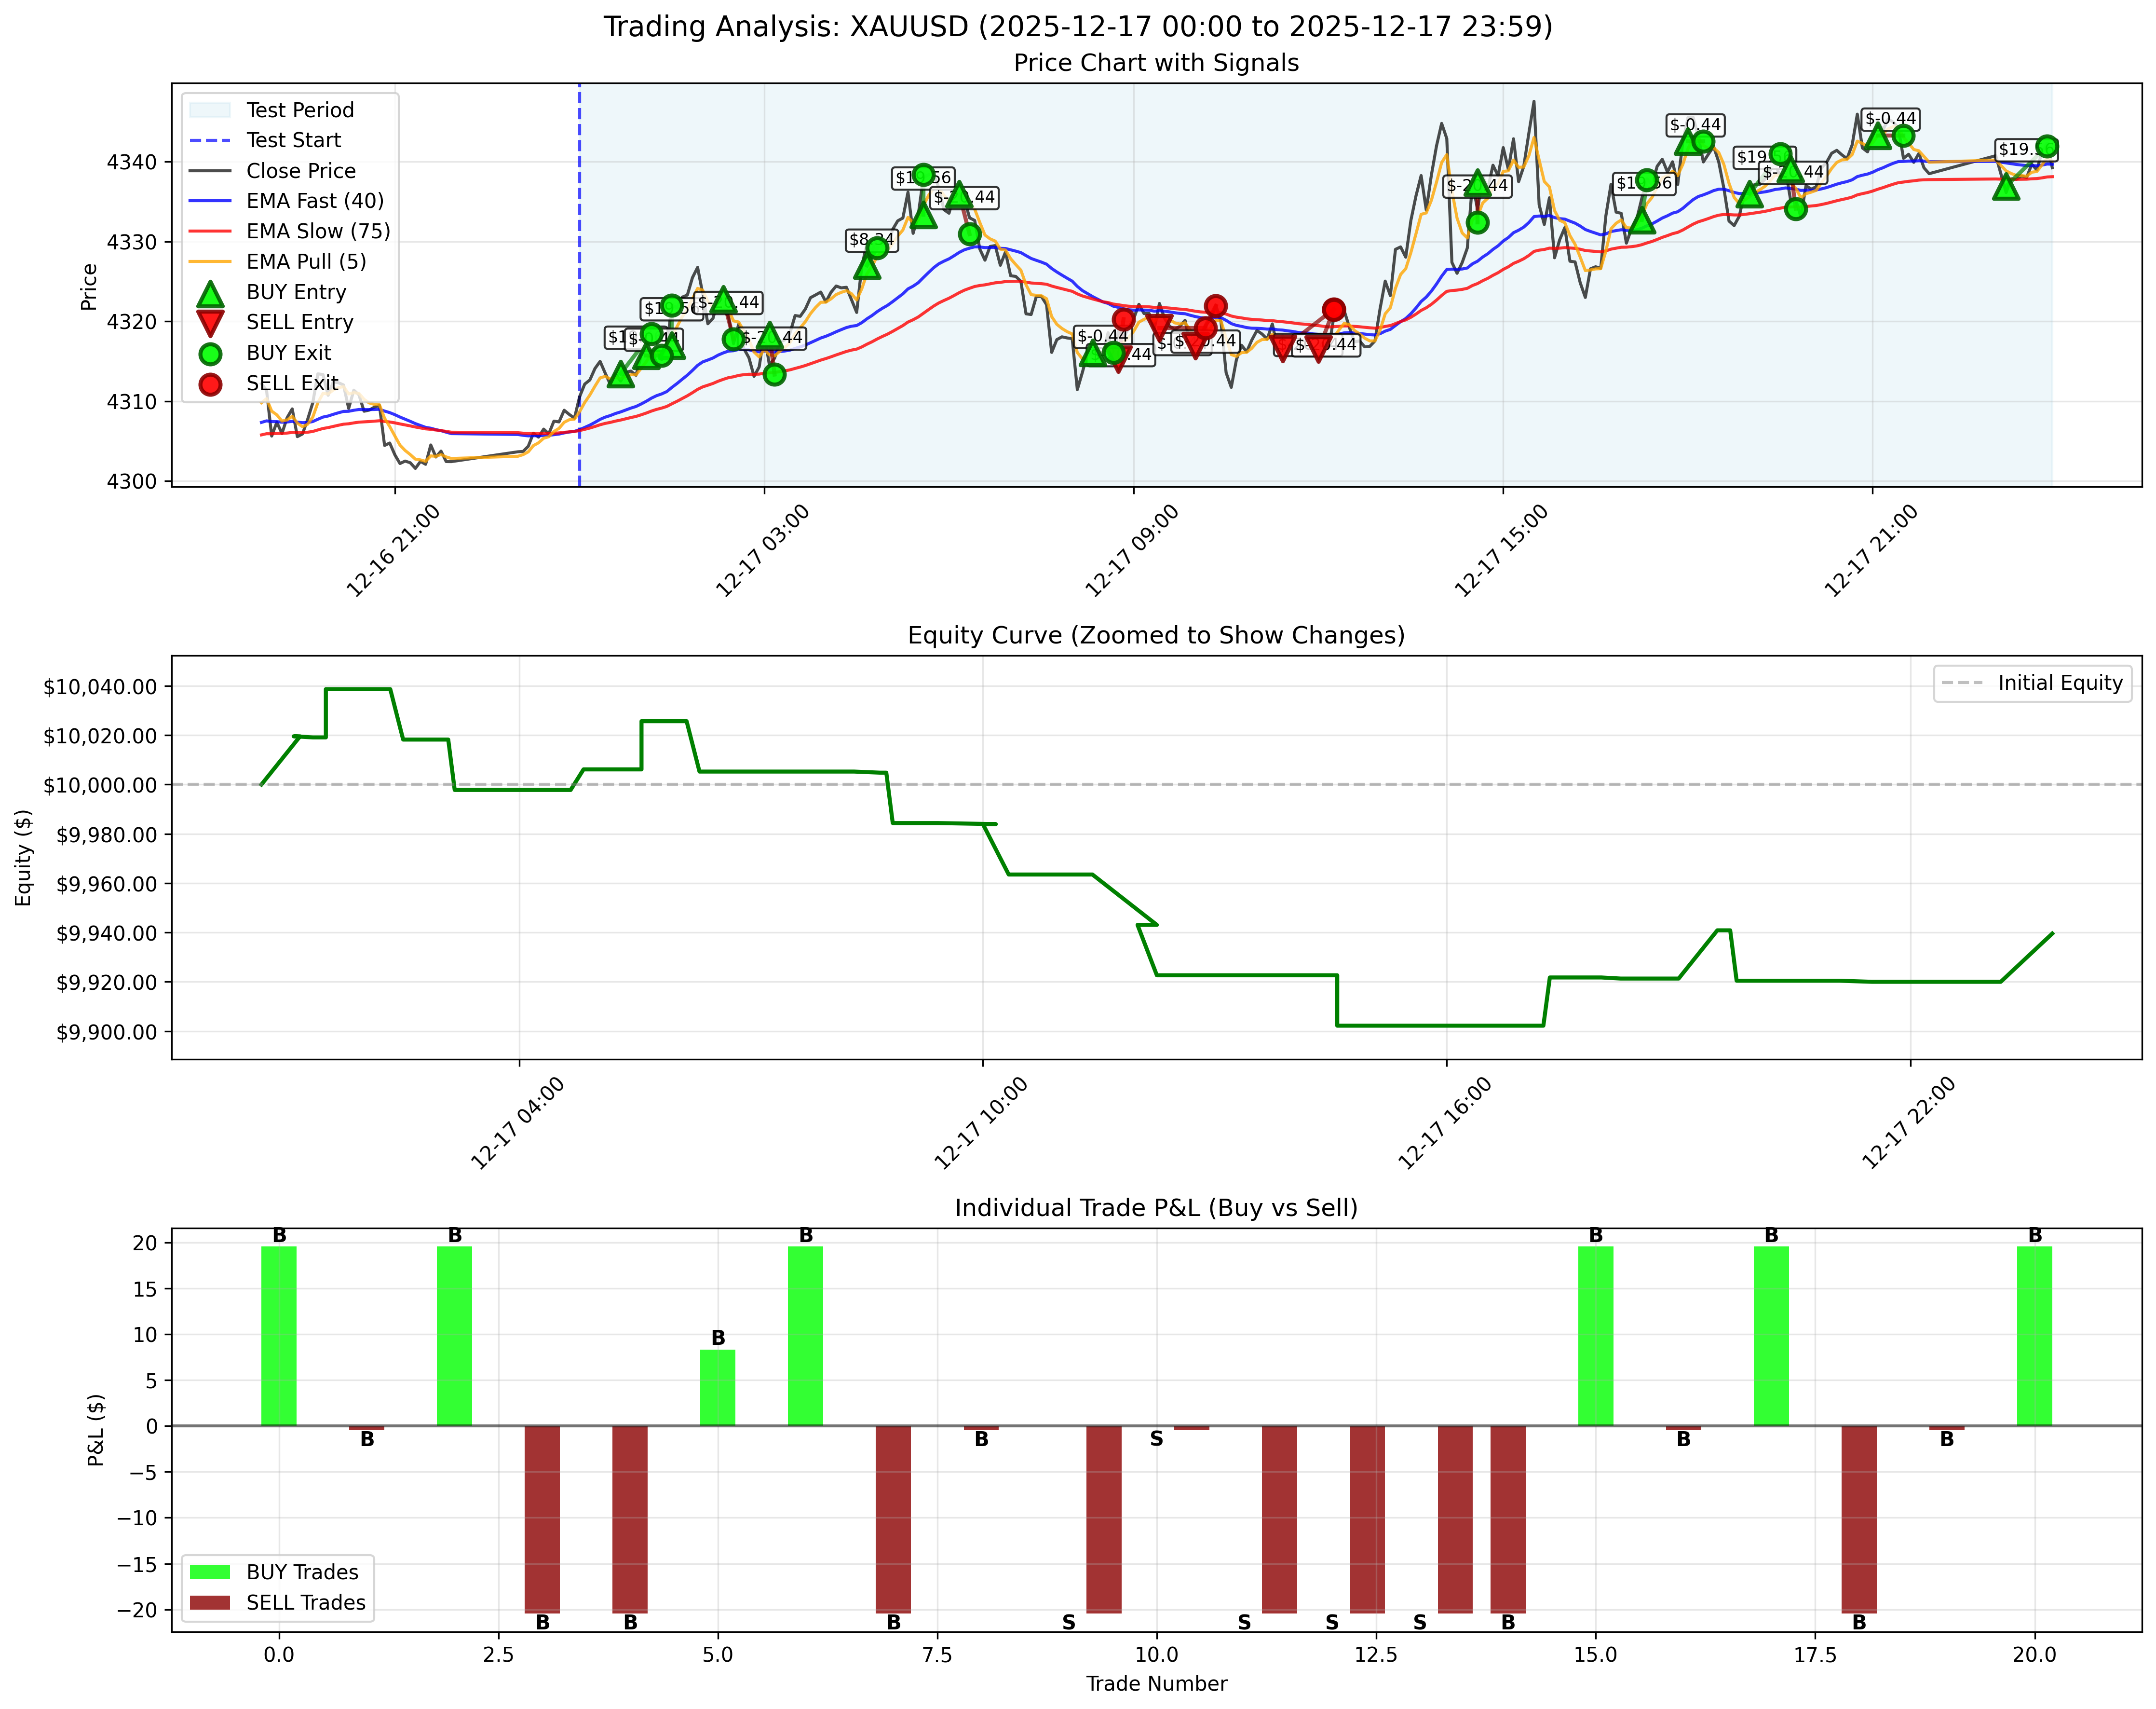
December 17, 2025 / 2025年12月17日
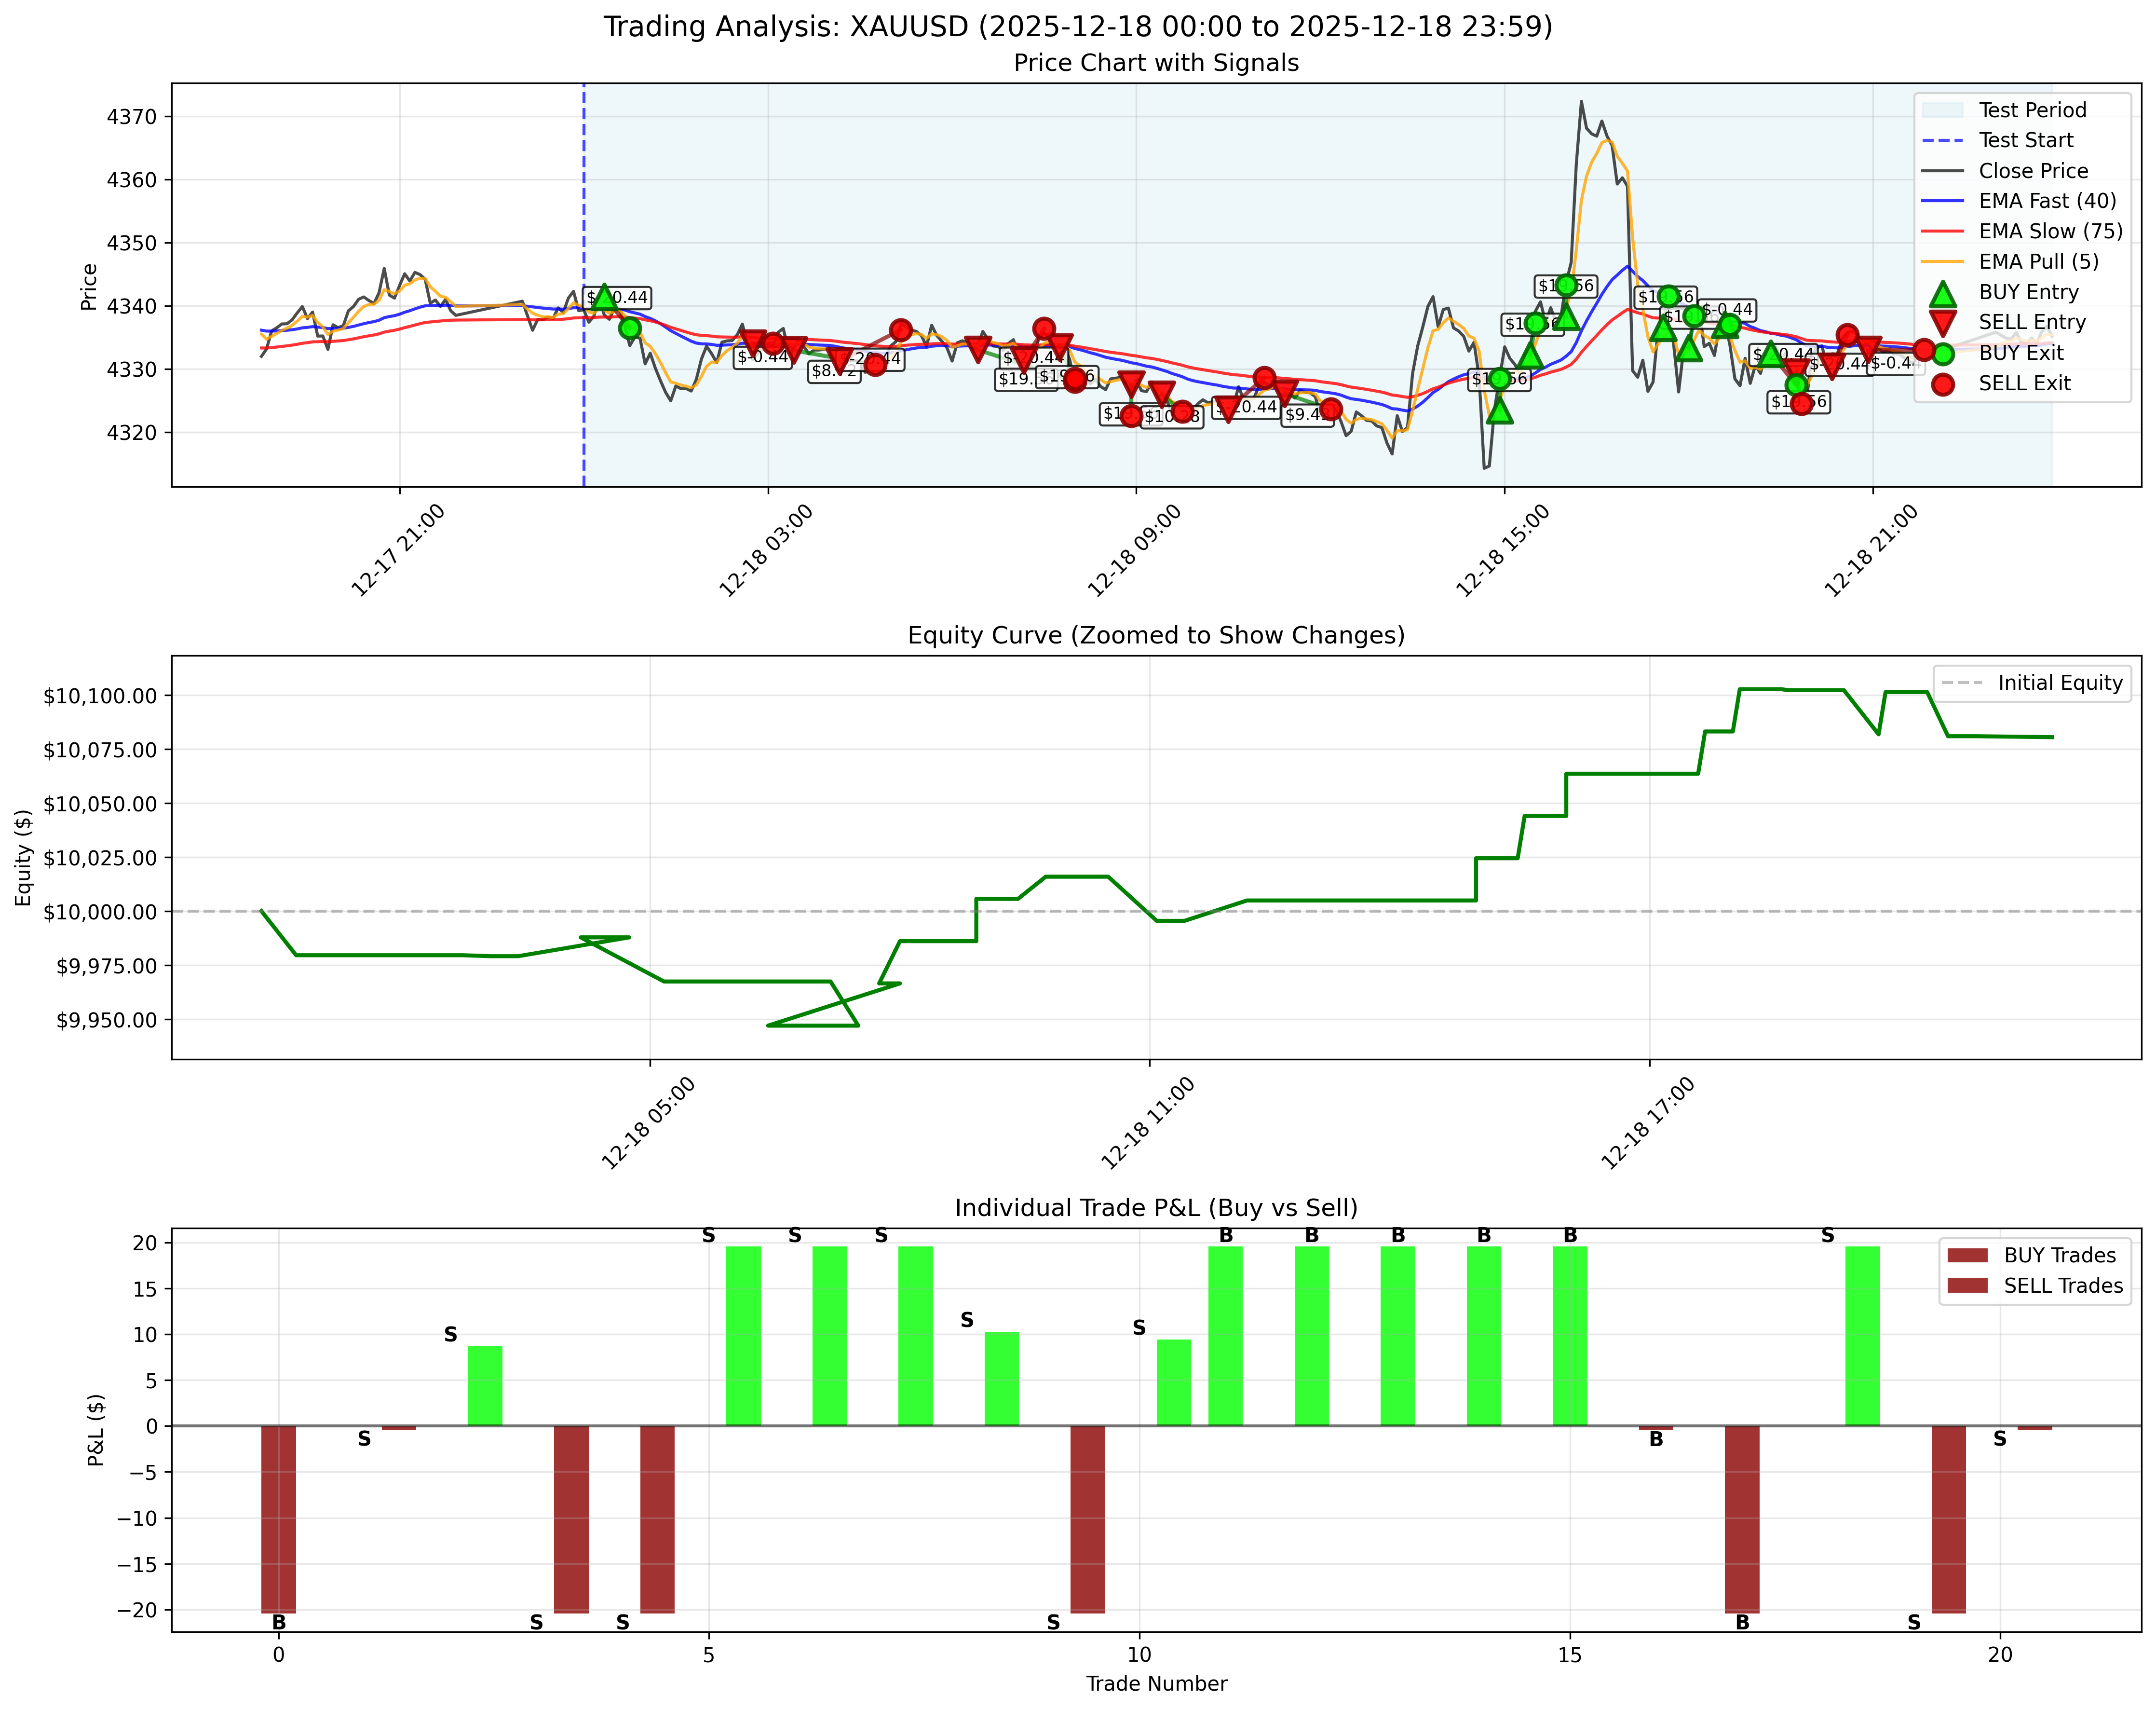
December 18, 2025 / 2025年12月18日
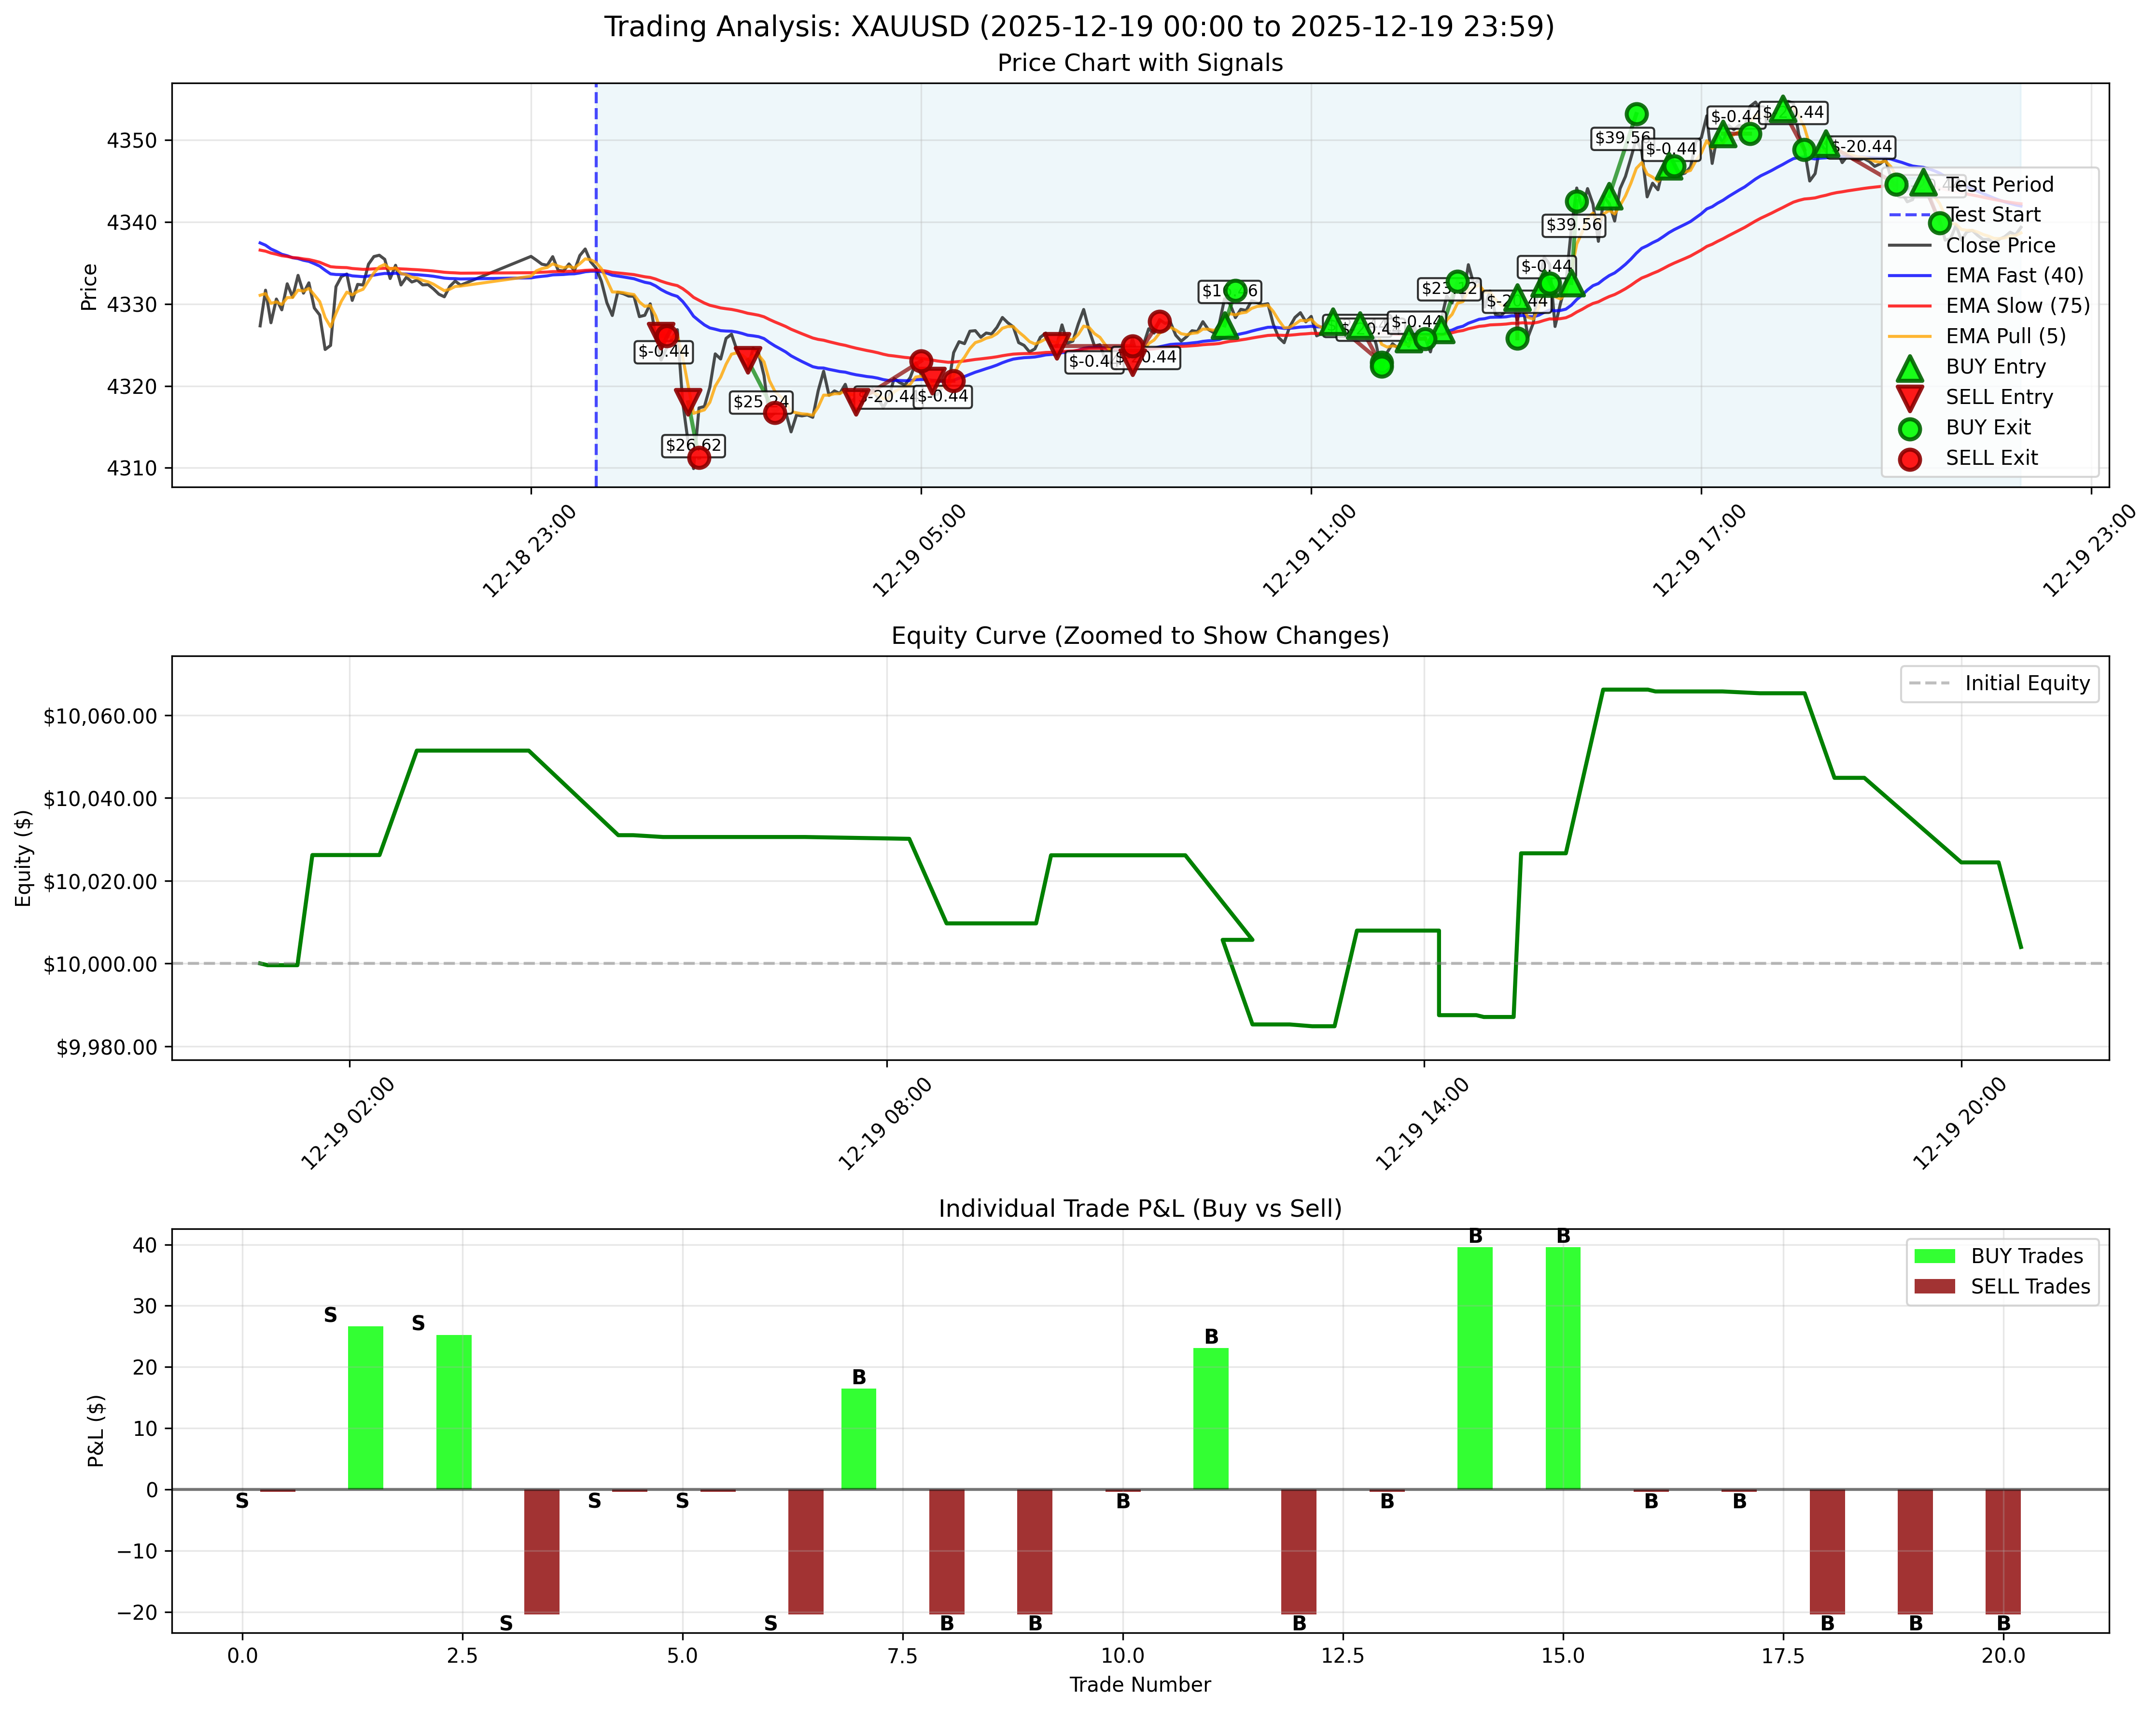
December 19, 2025 / 2025年12月19日
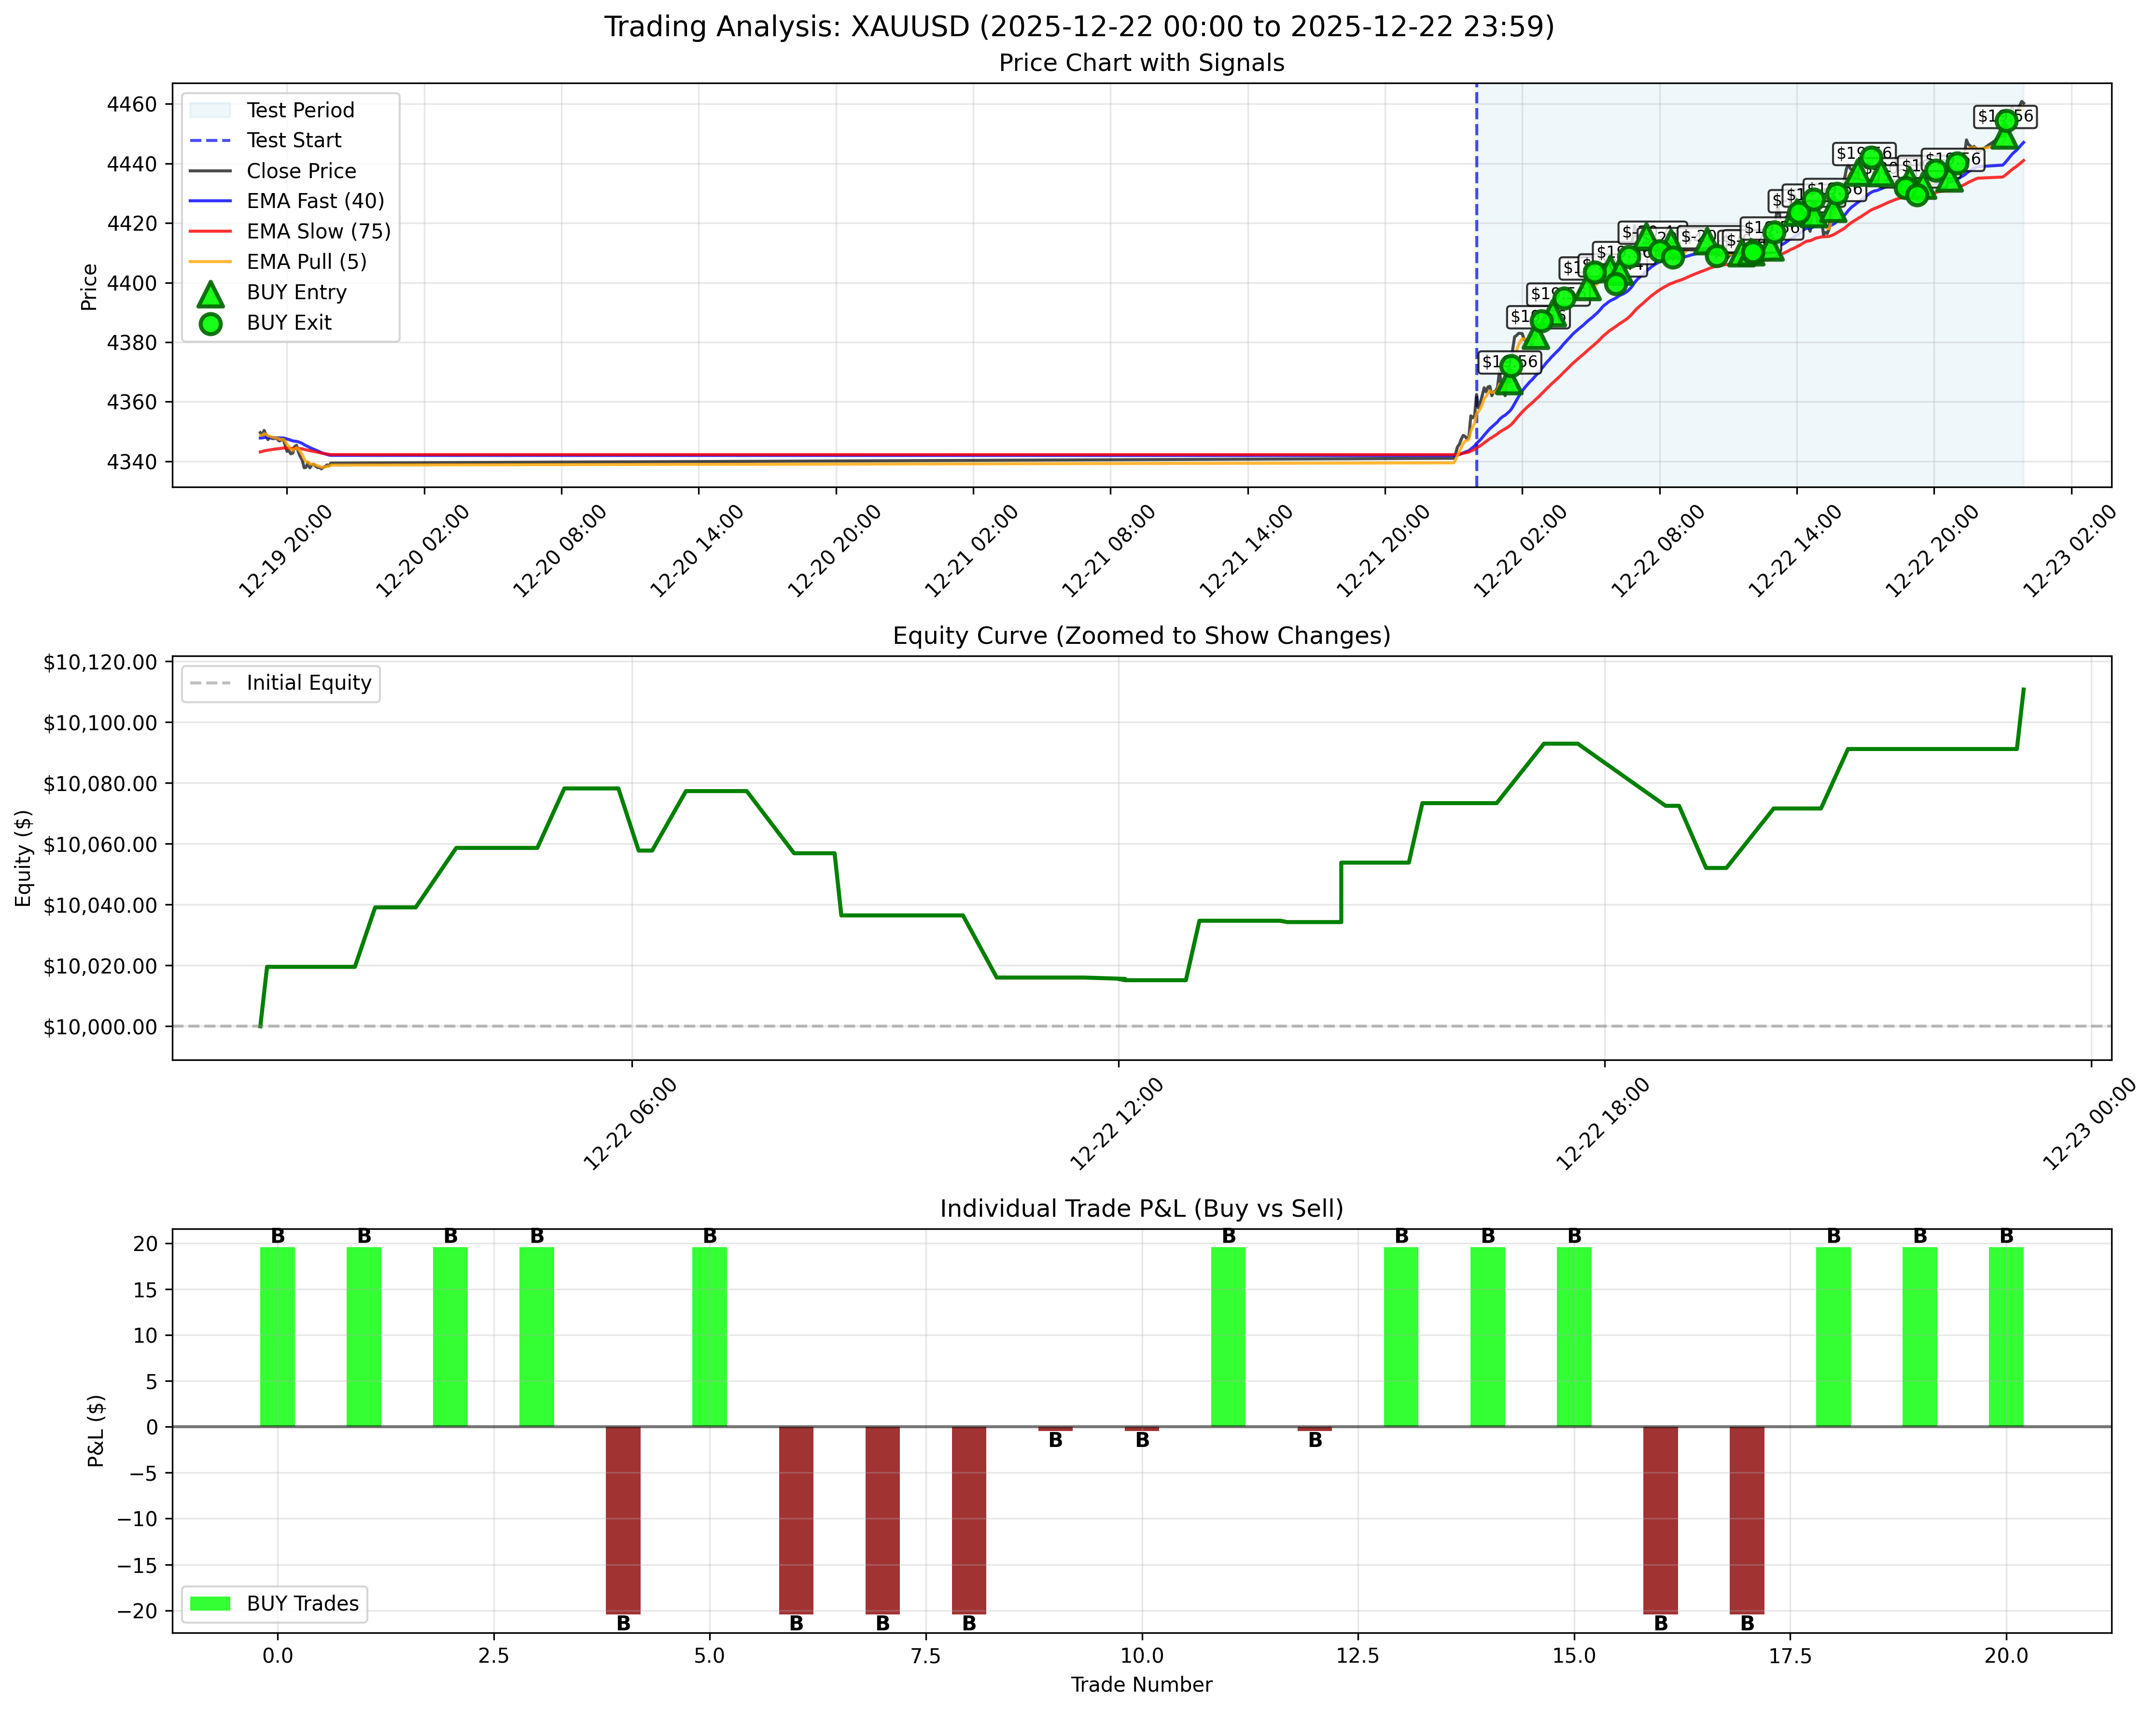
December 22, 2025 - Highest Profit Day / 2025年12月22日 - 最高利益日
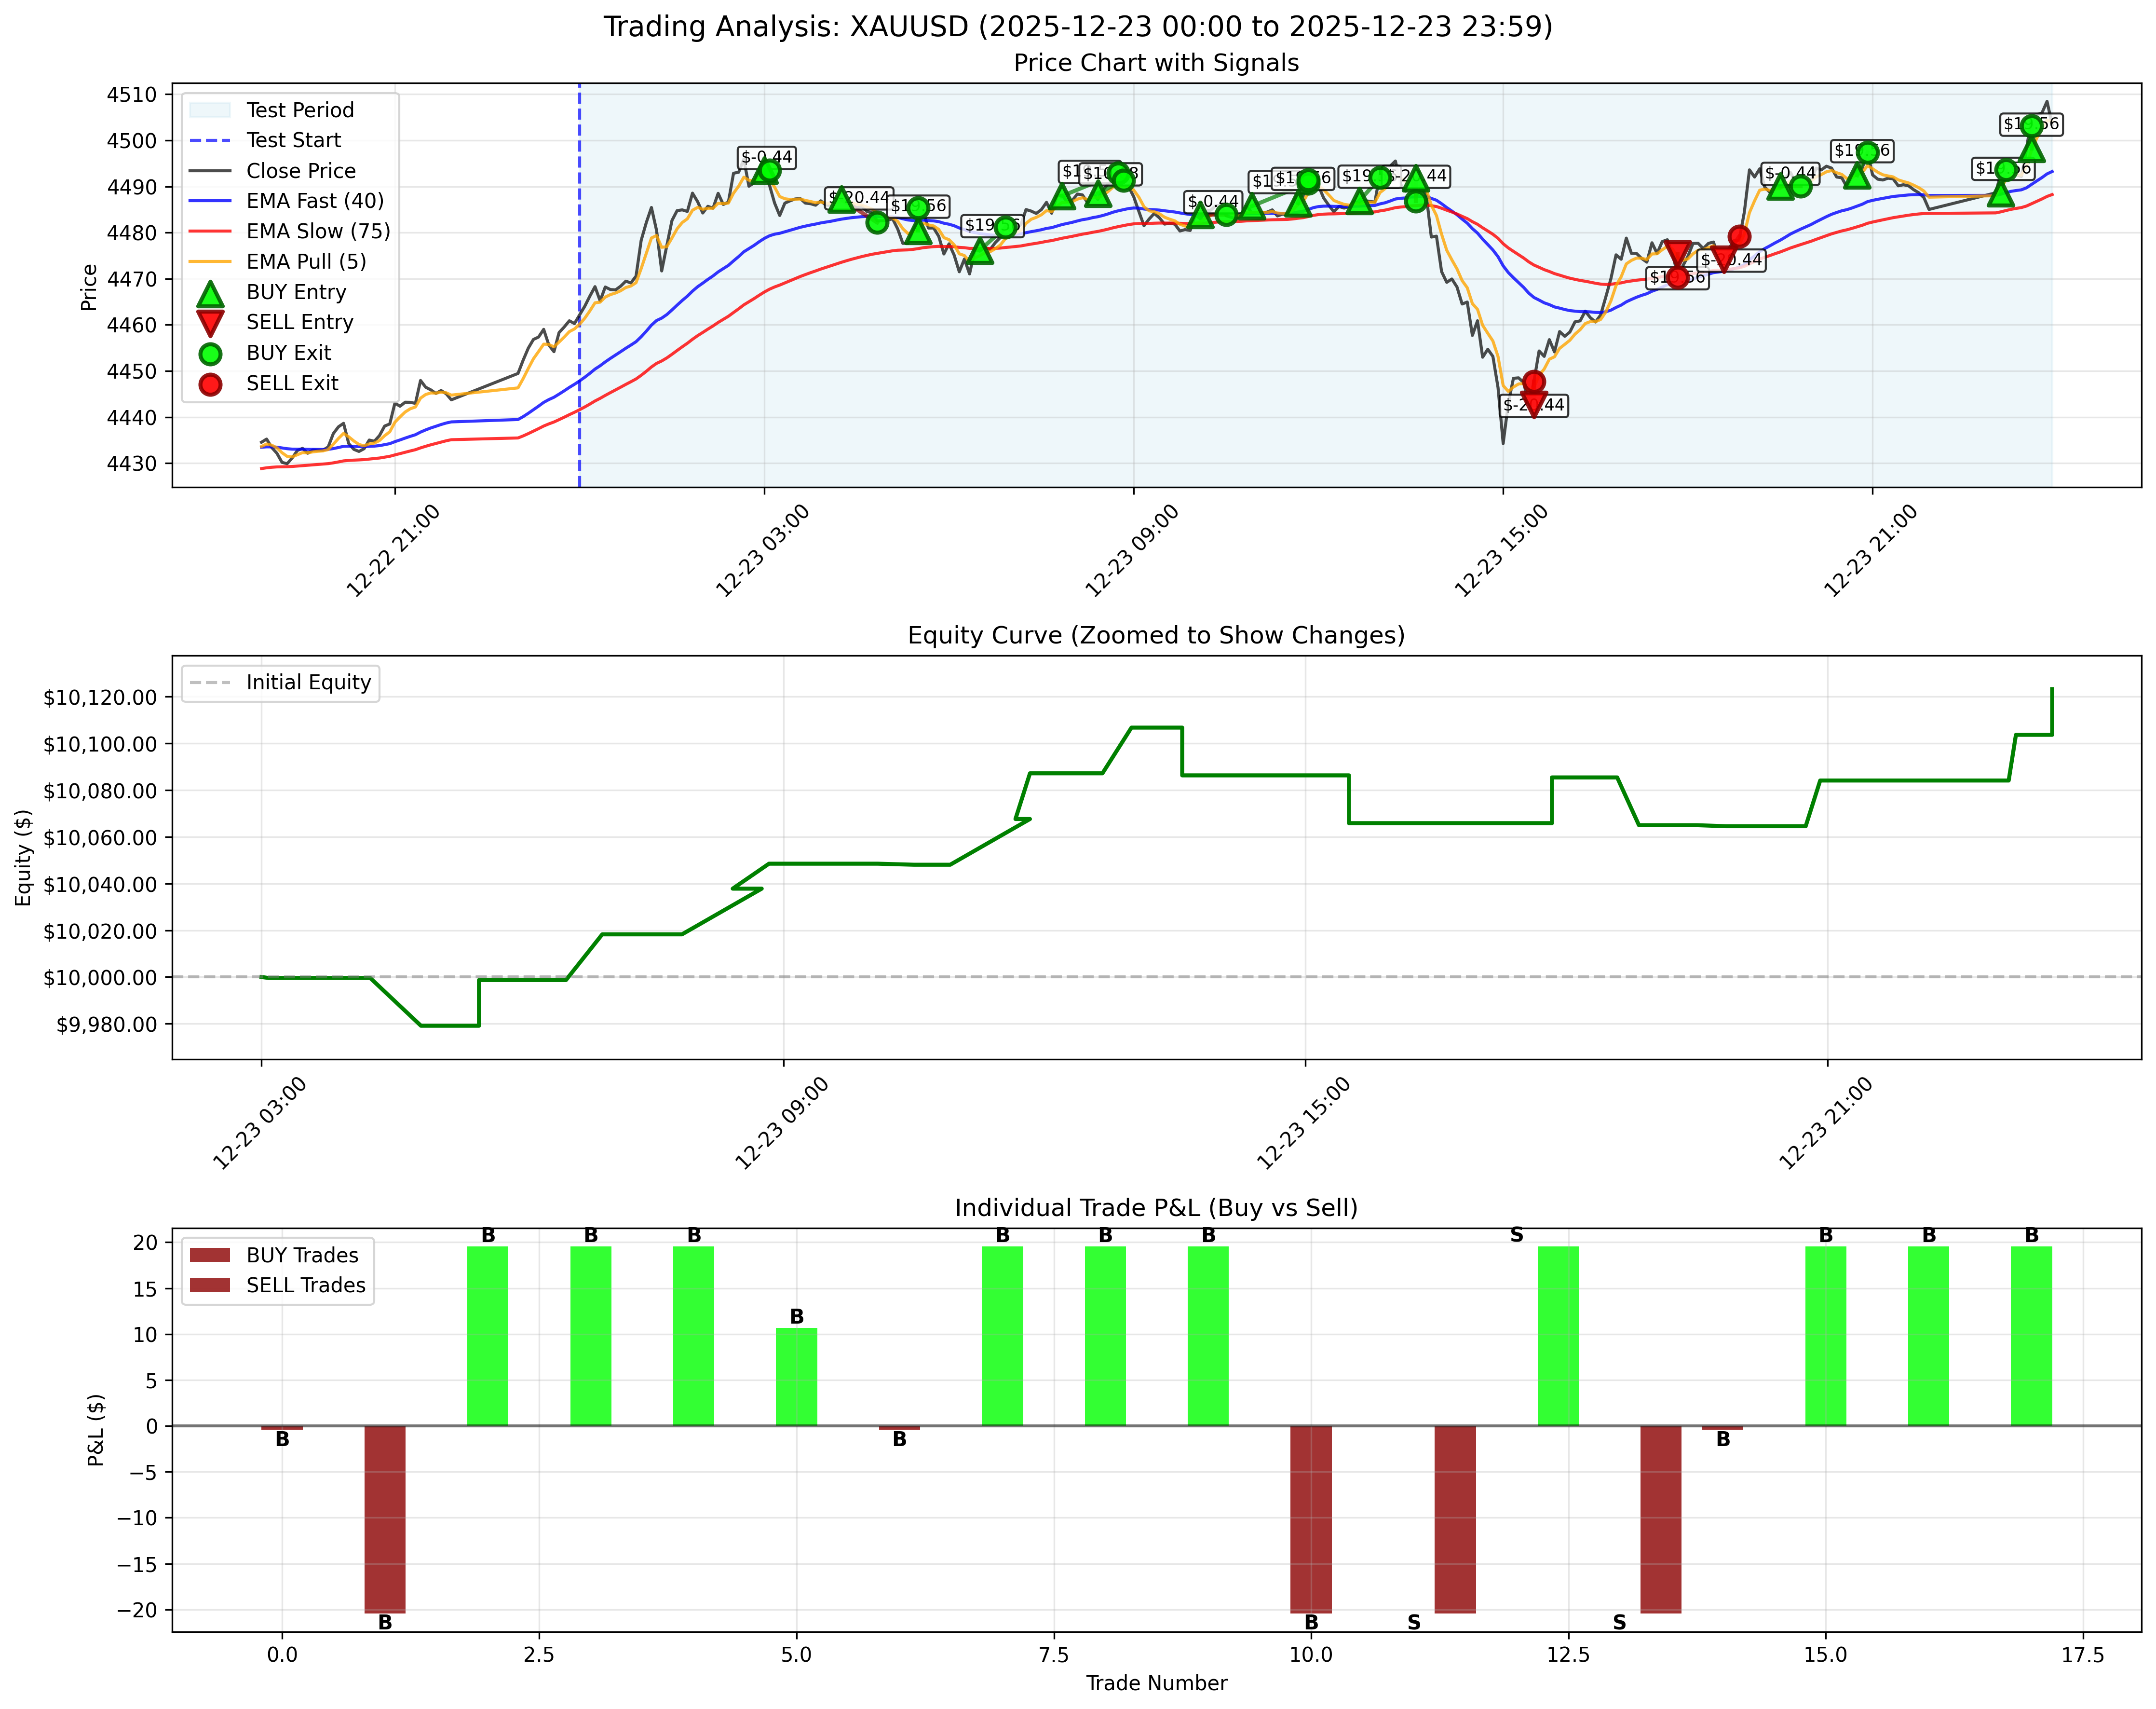
December 23, 2025 / 2025年12月23日
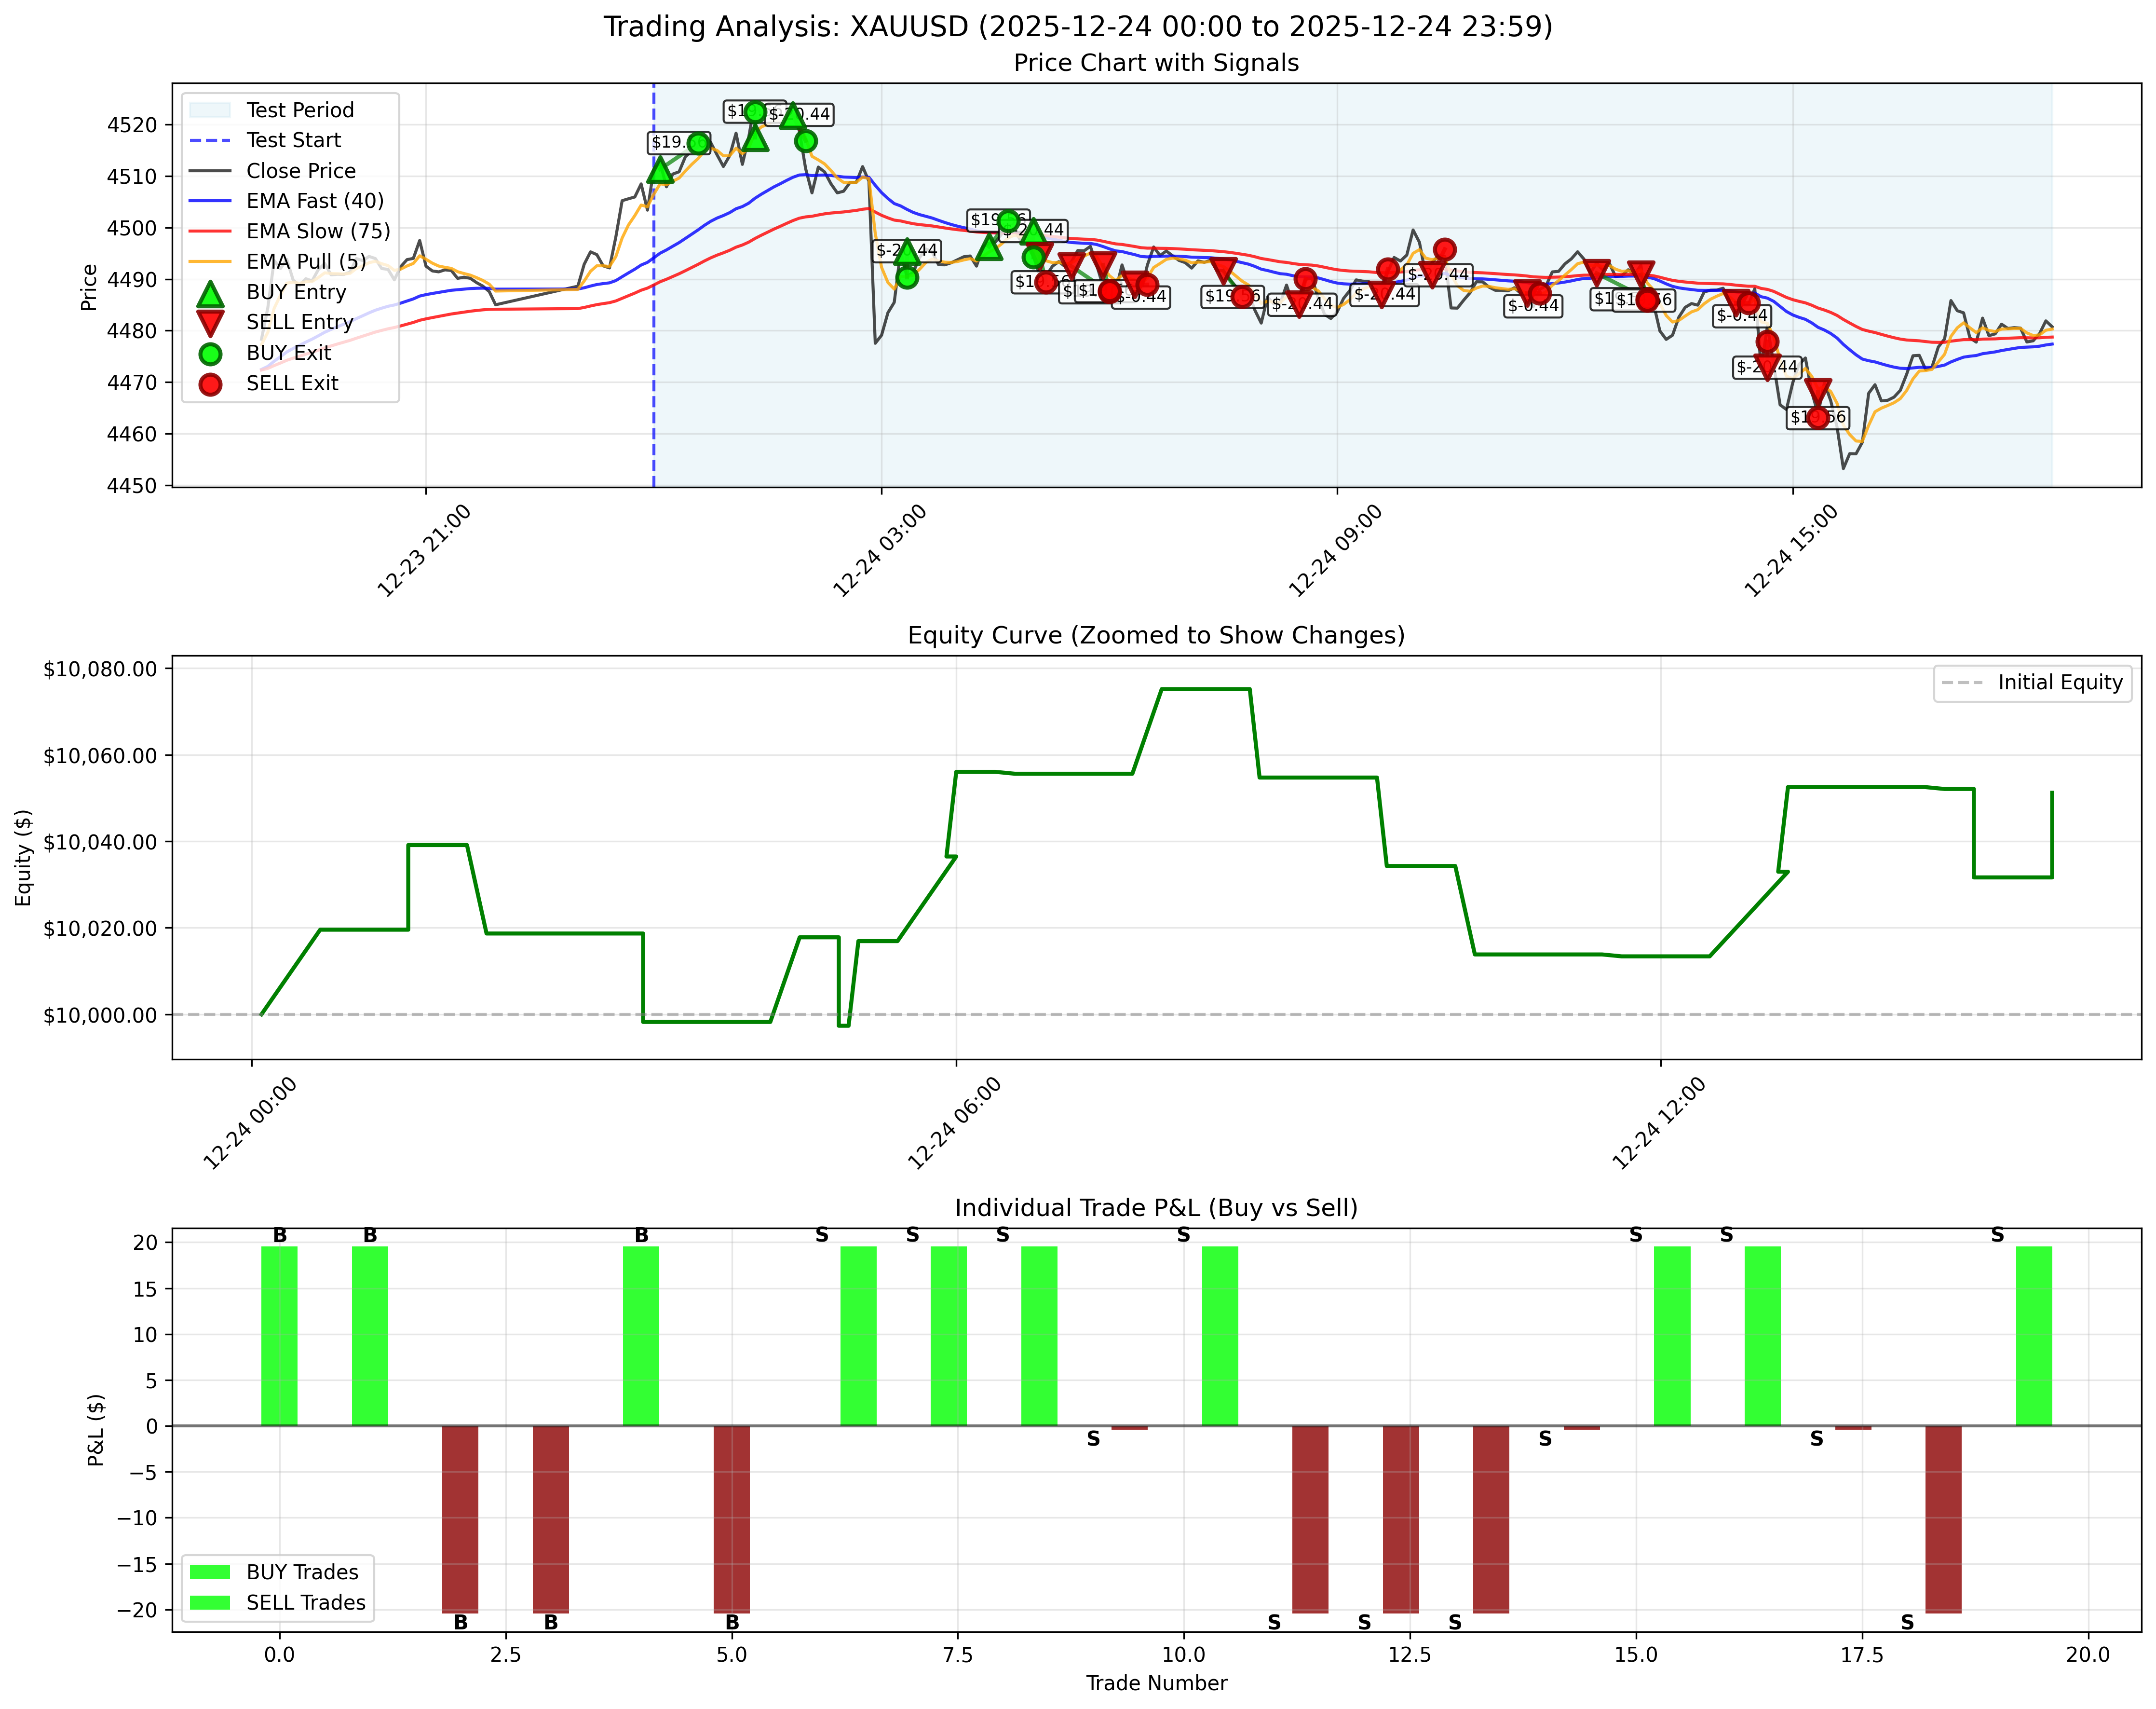
December 24, 2025 / 2025年12月24日
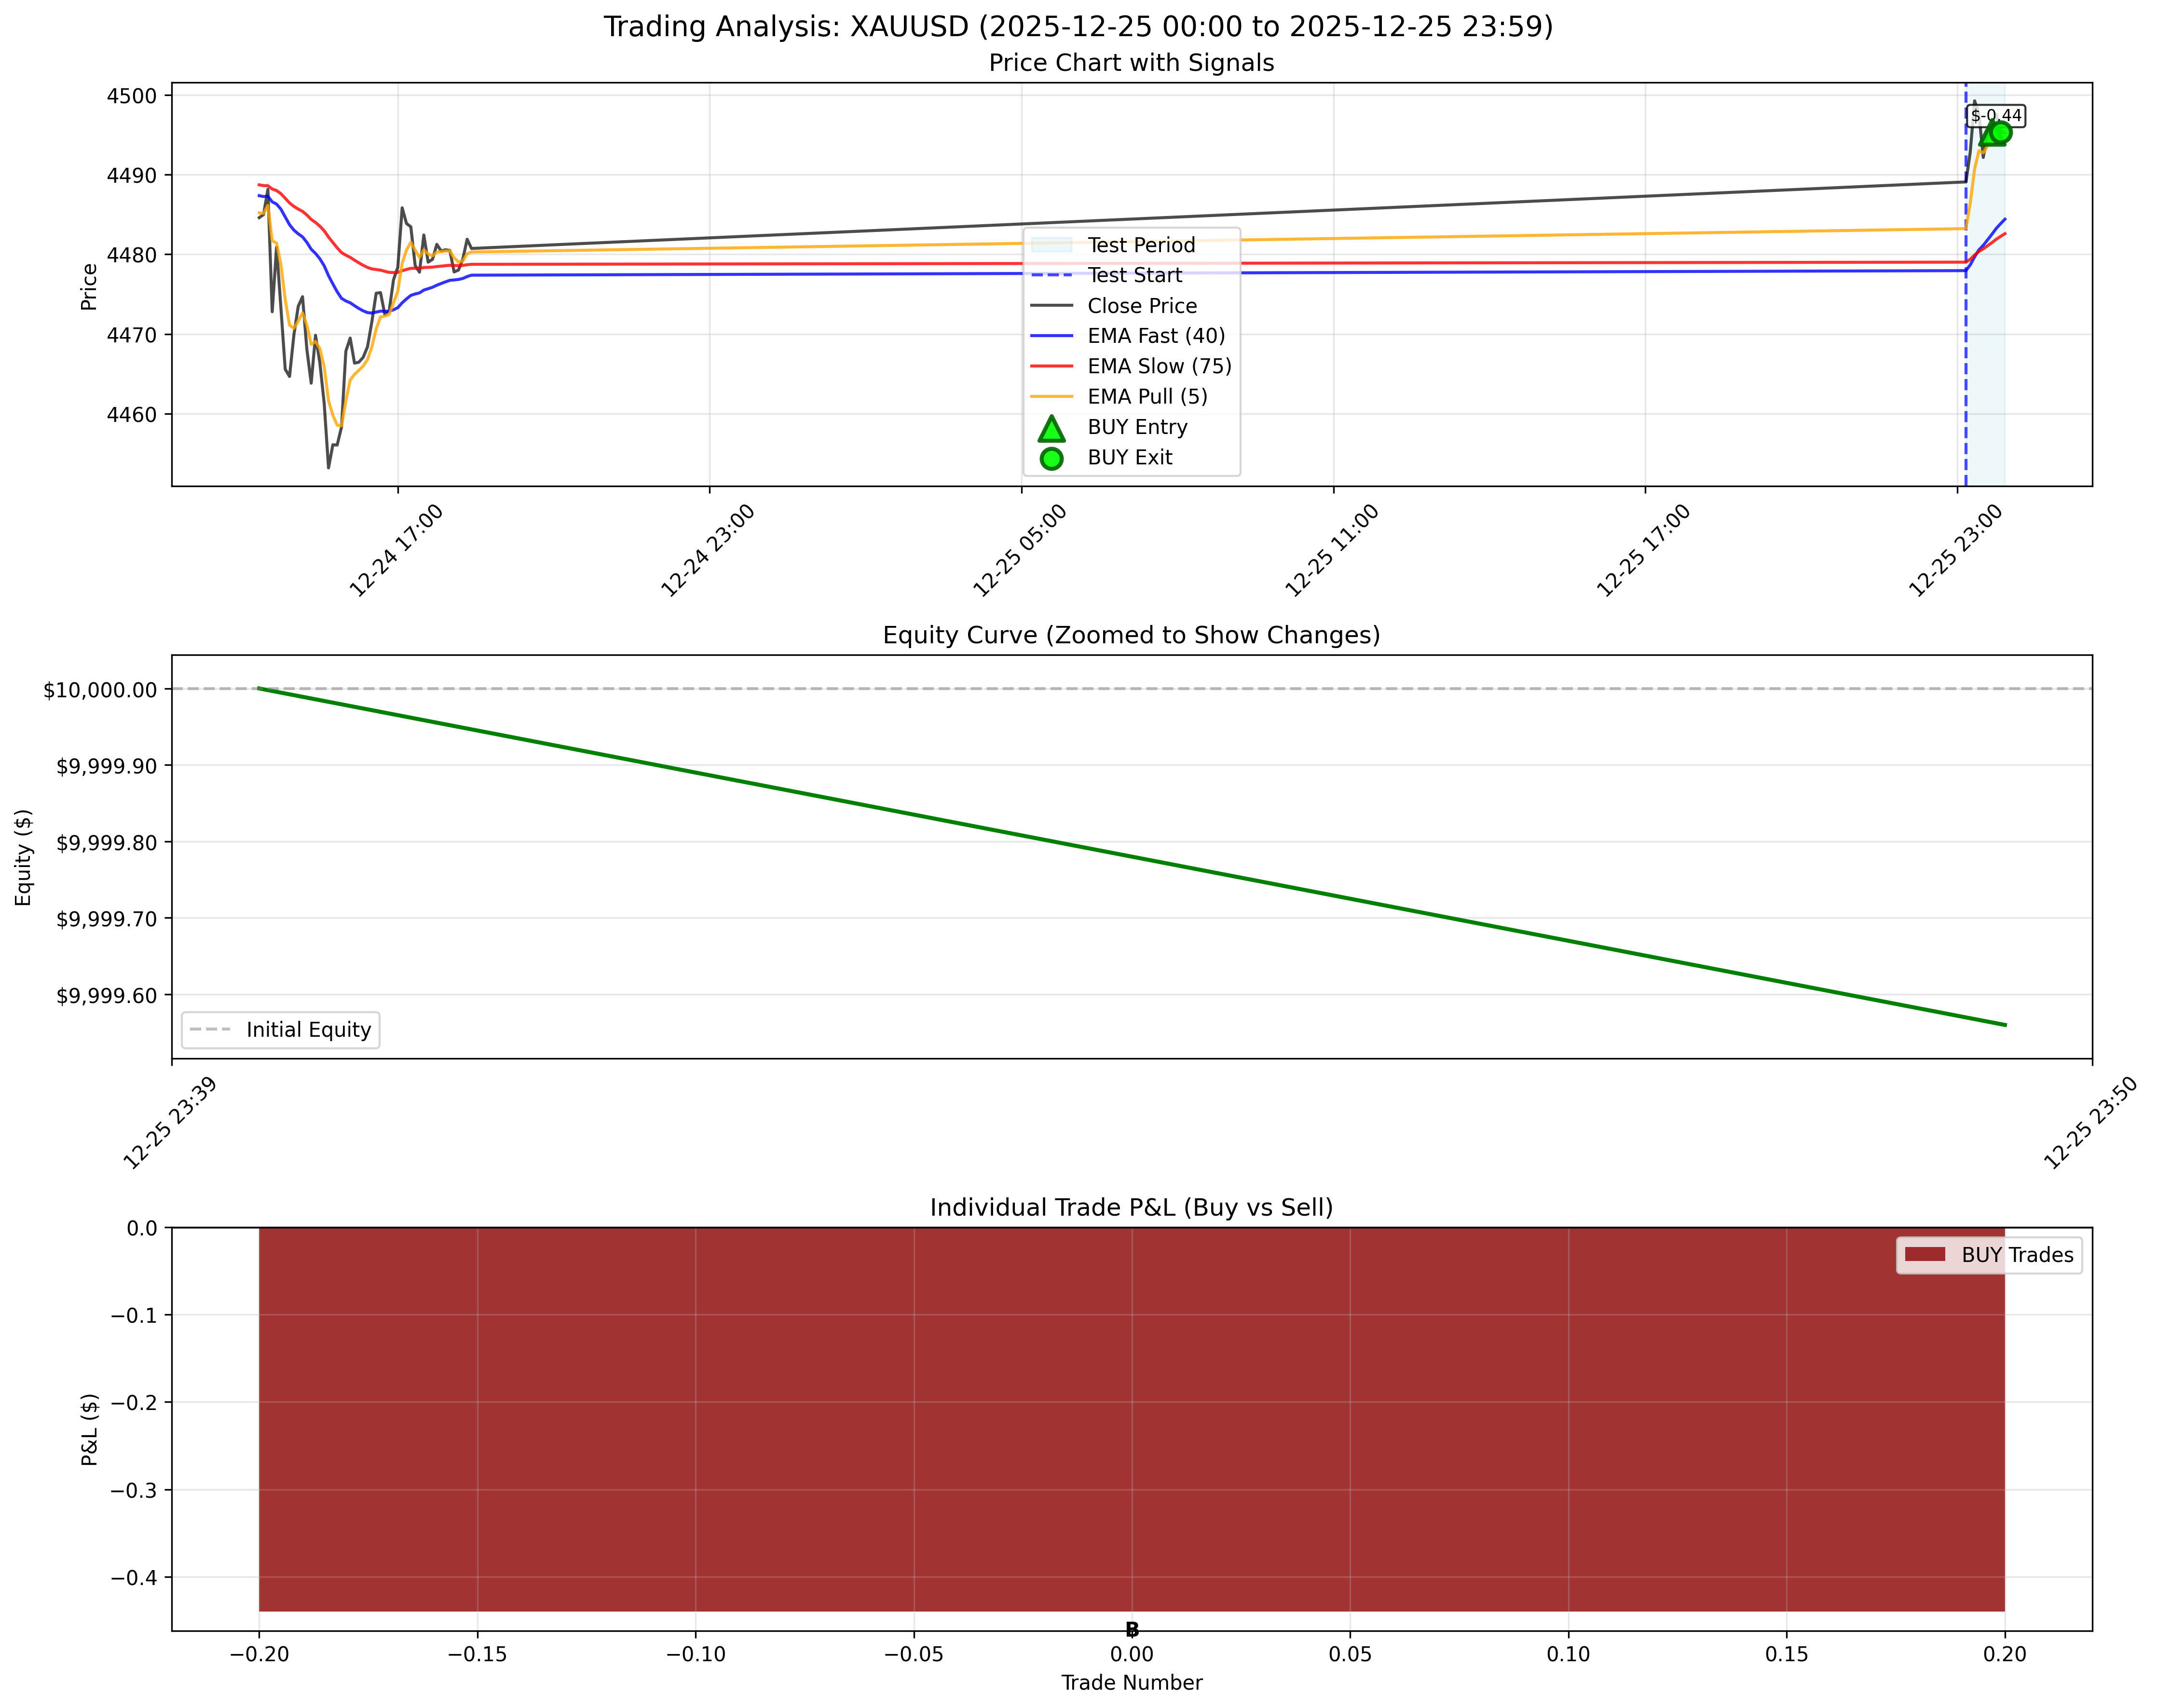
December 25, 2025 / 2025年12月25日
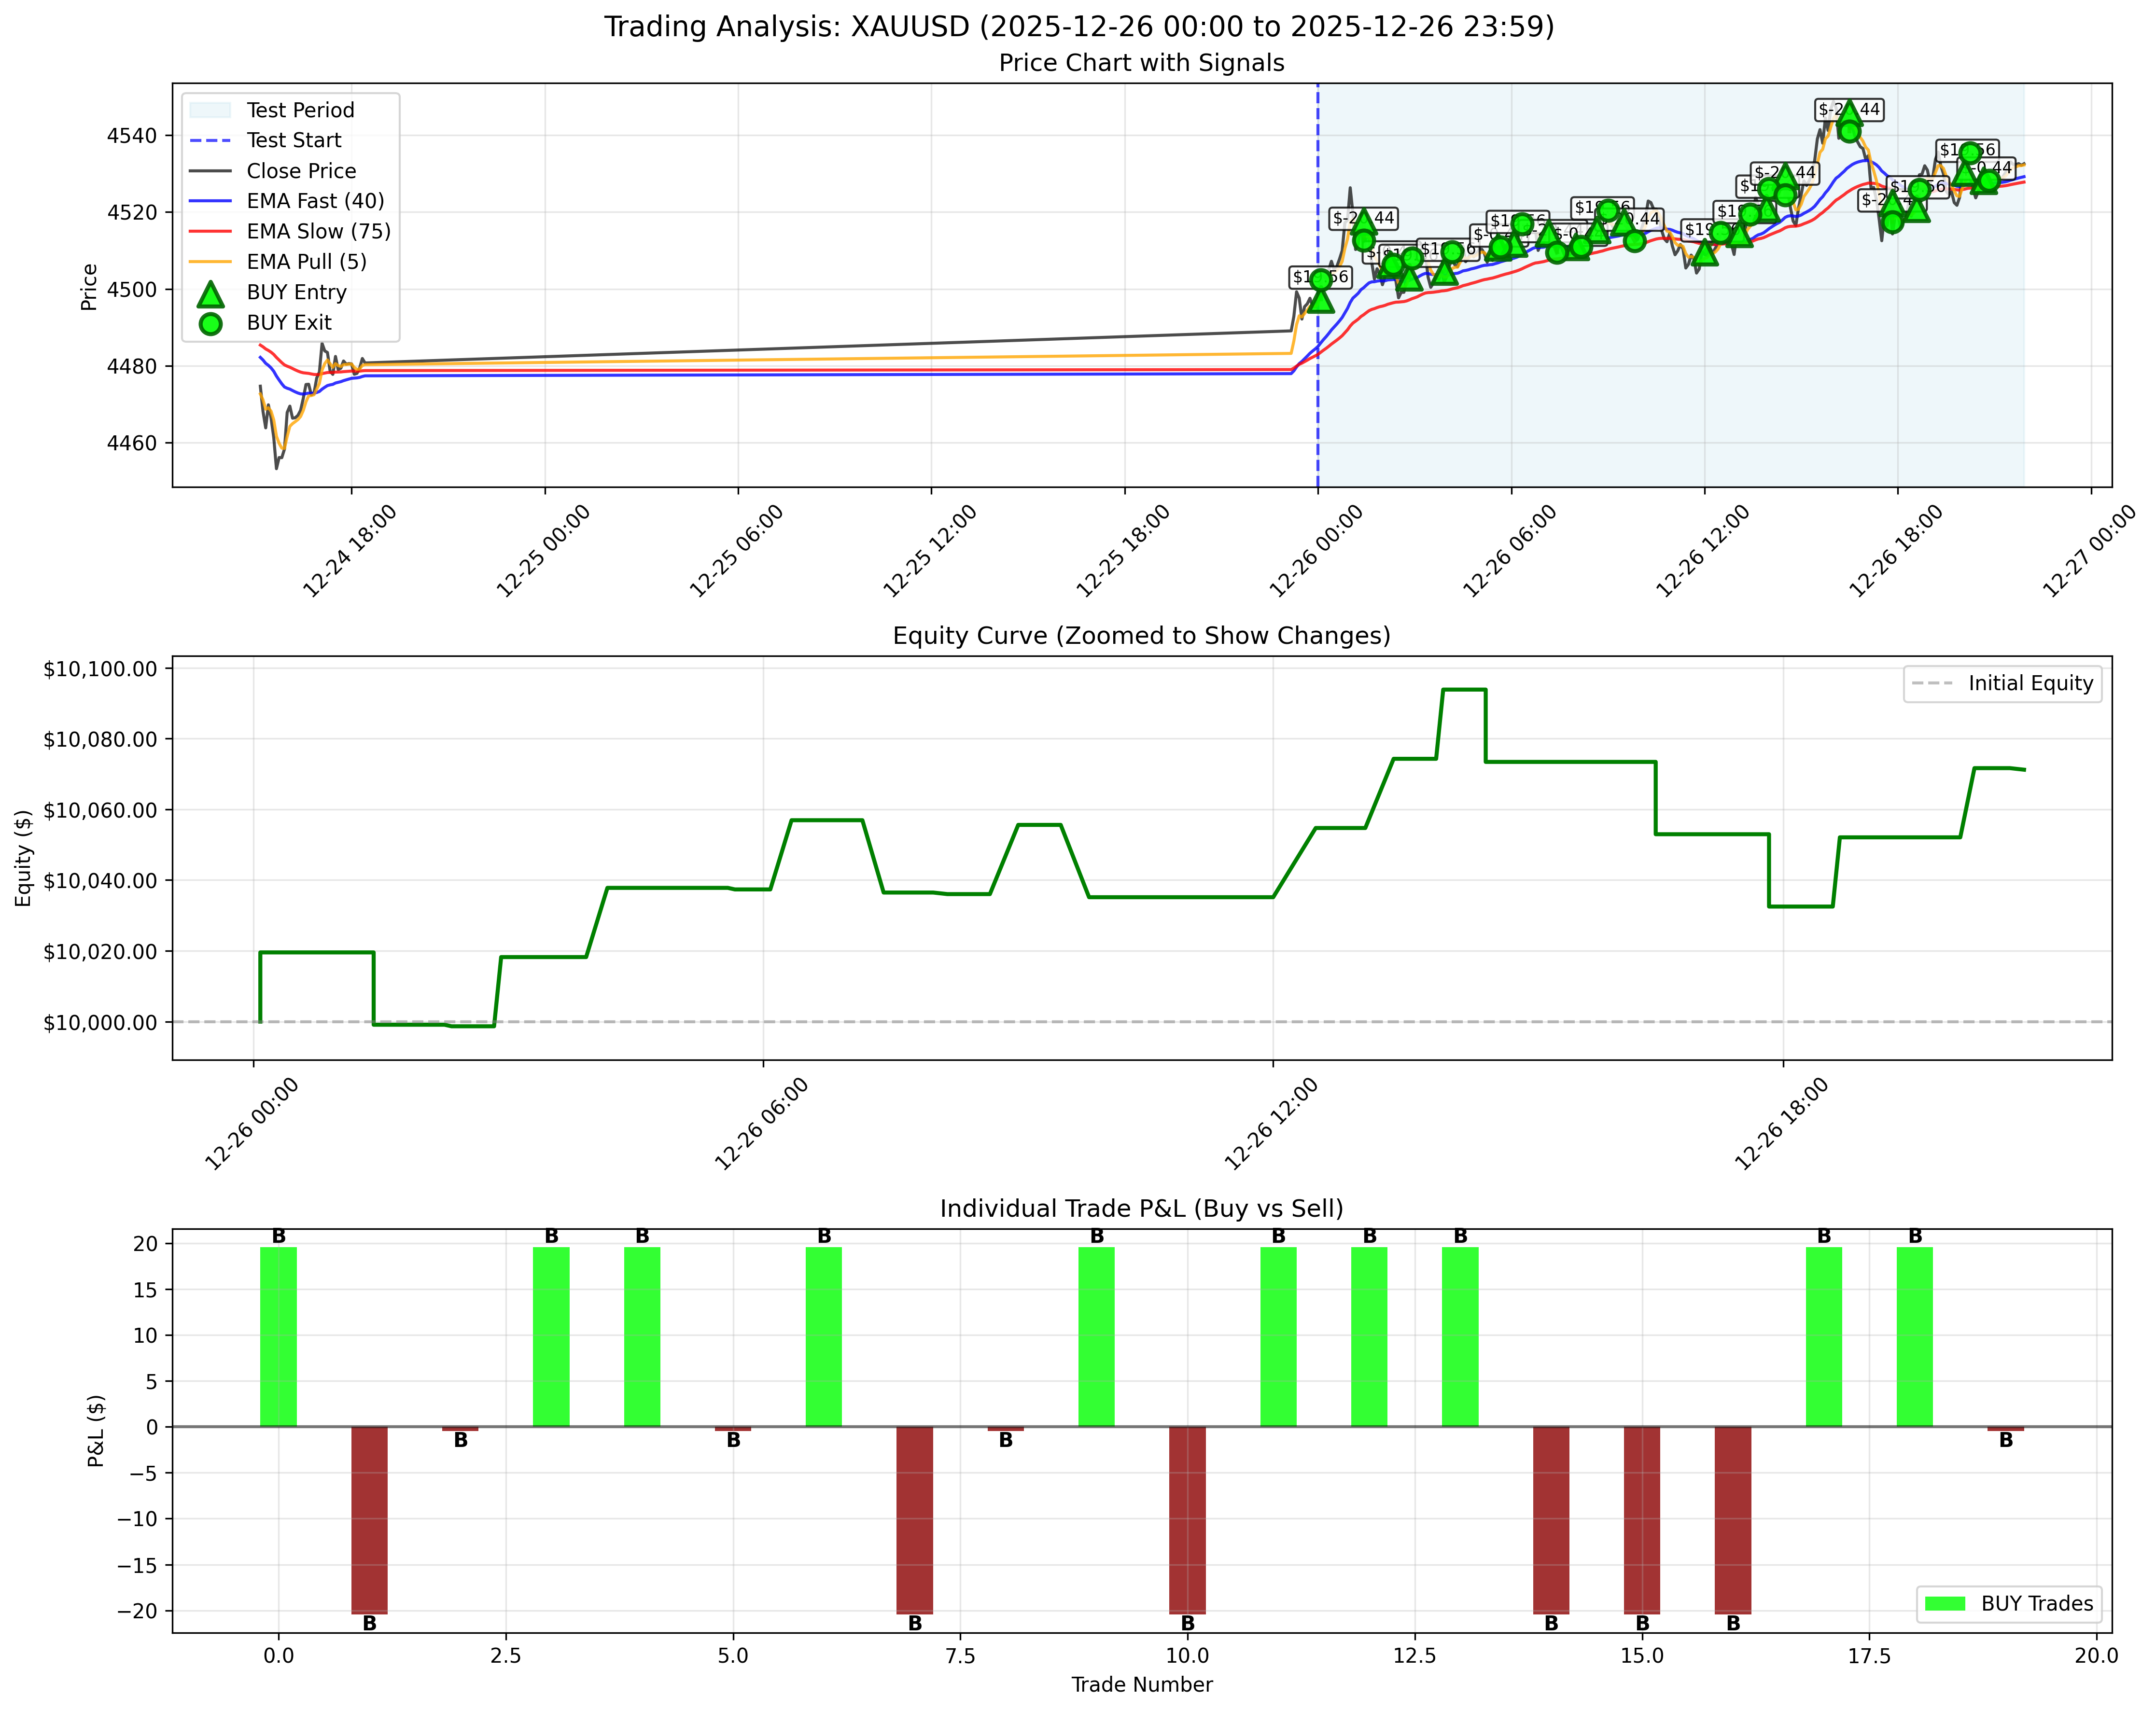
December 26, 2025 / 2025年12月26日
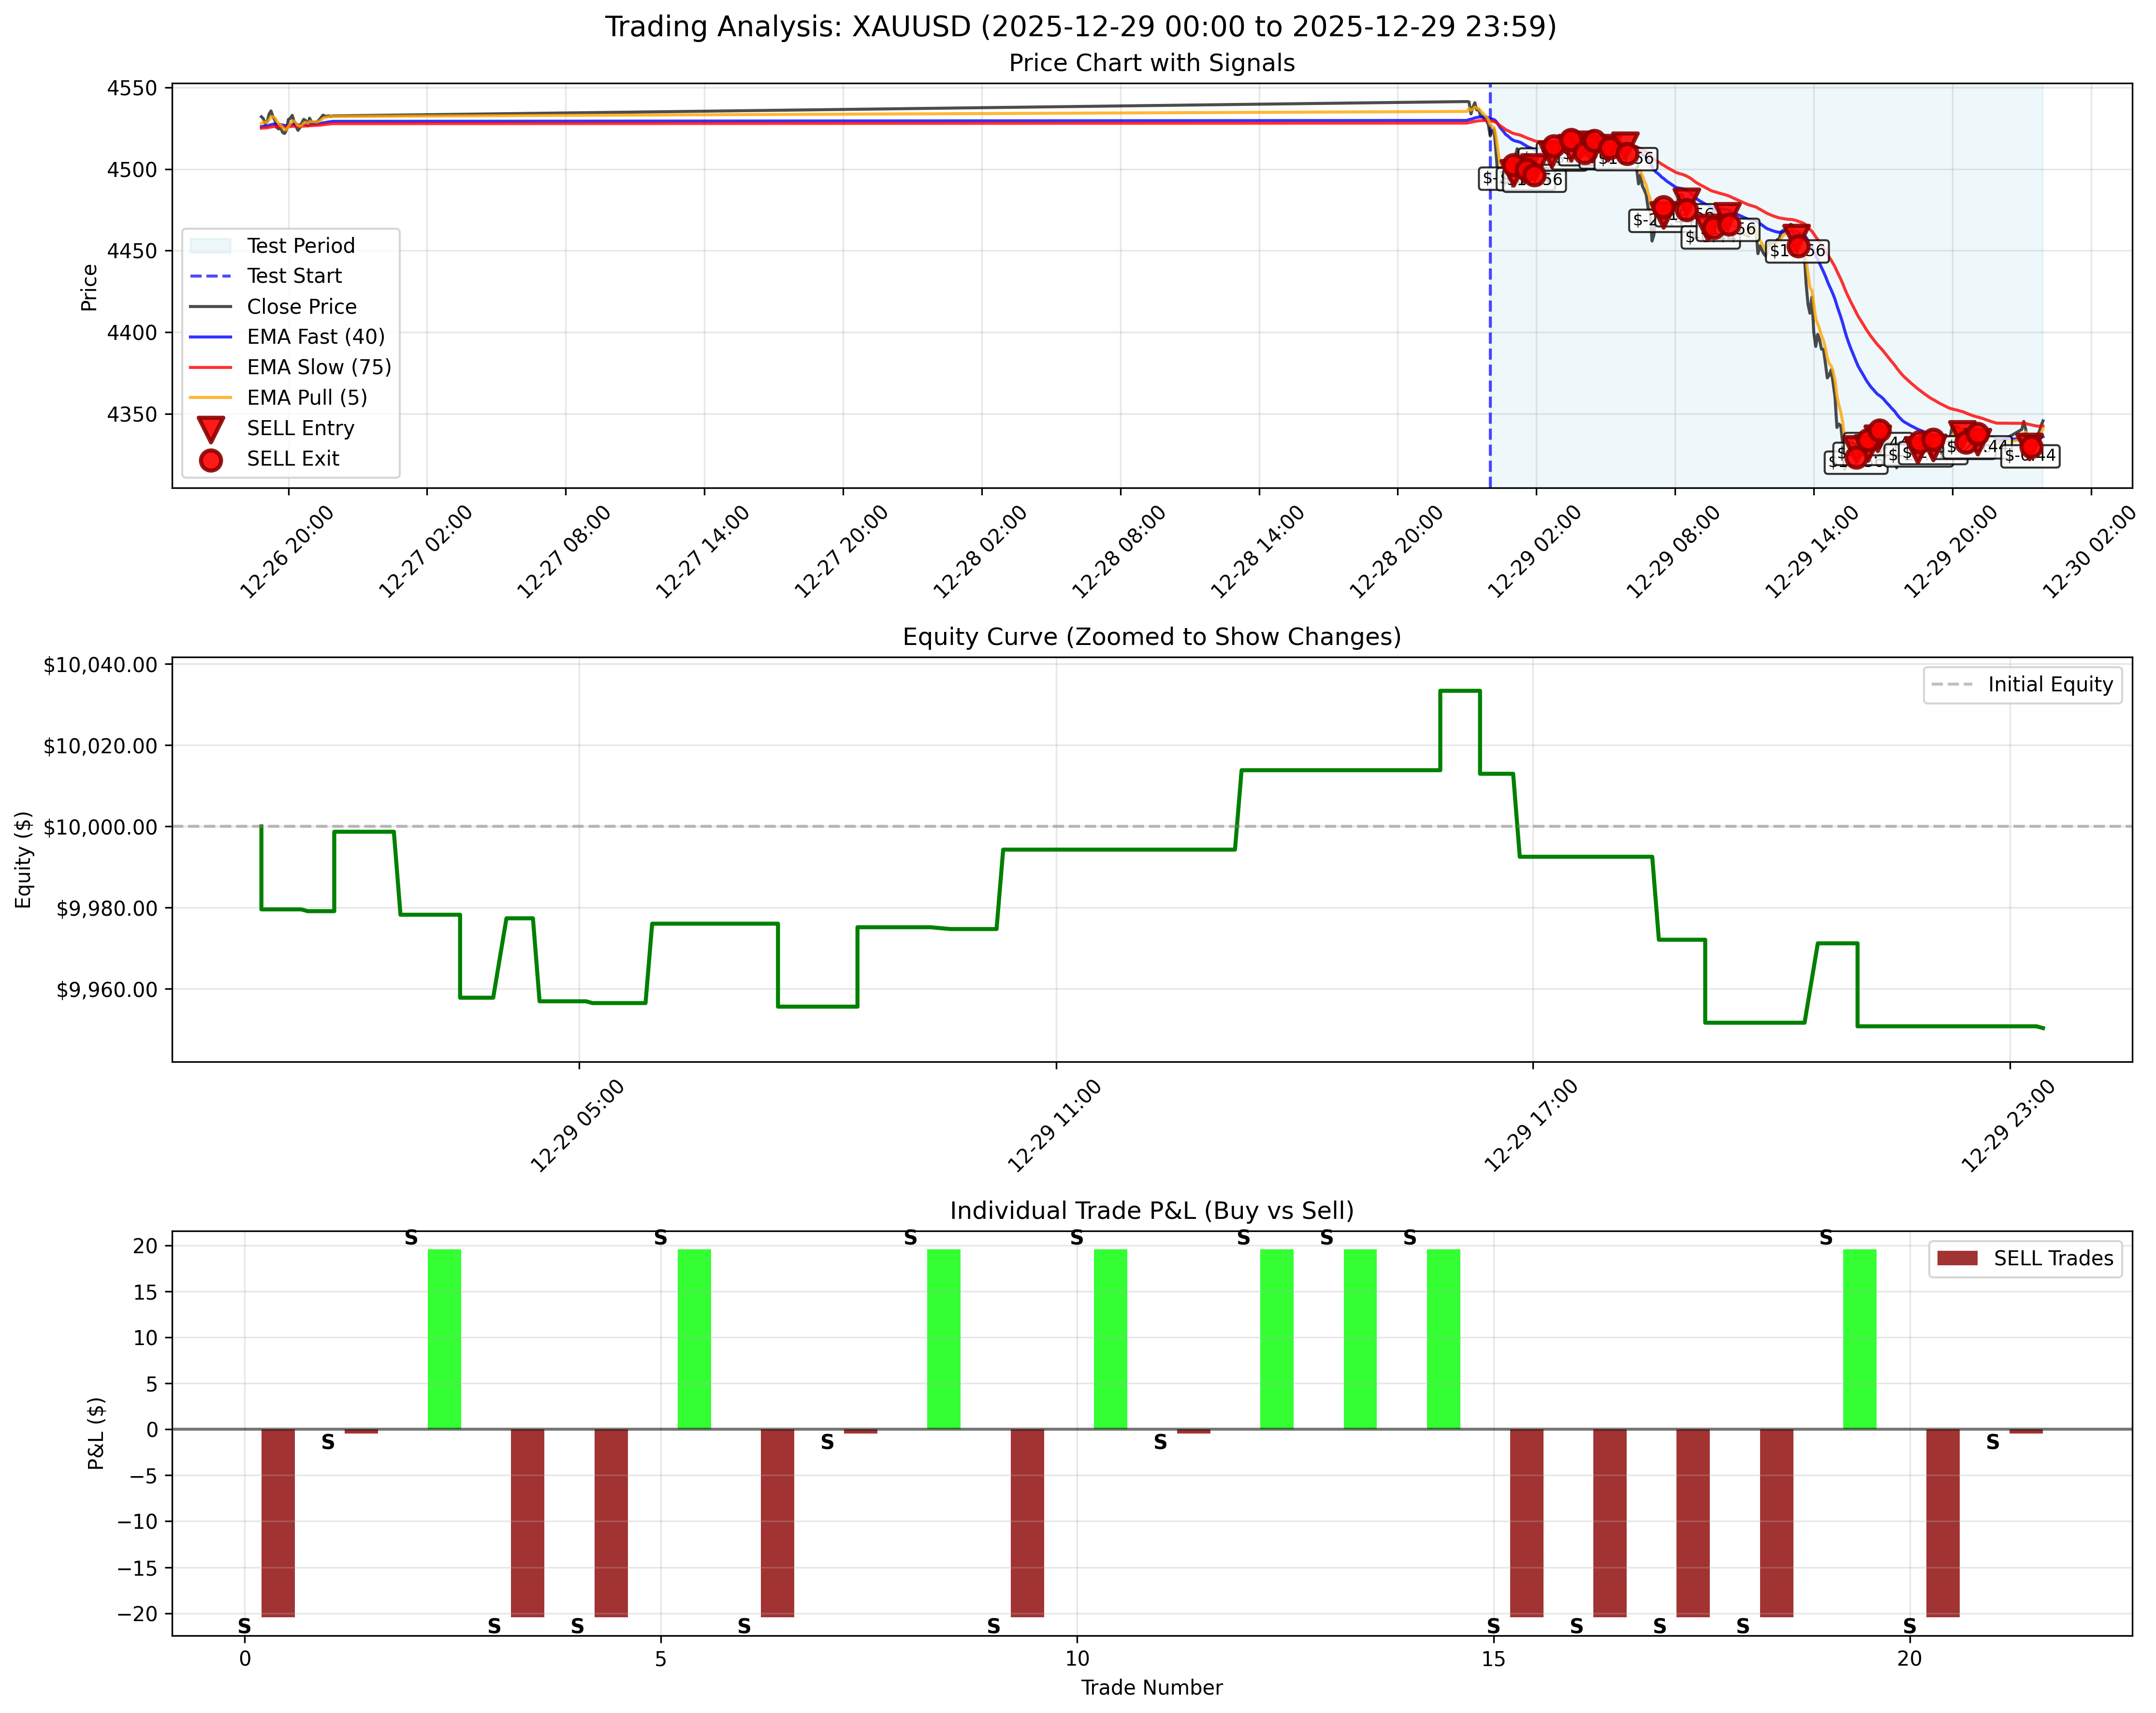
December 29, 2025 / 2025年12月29日
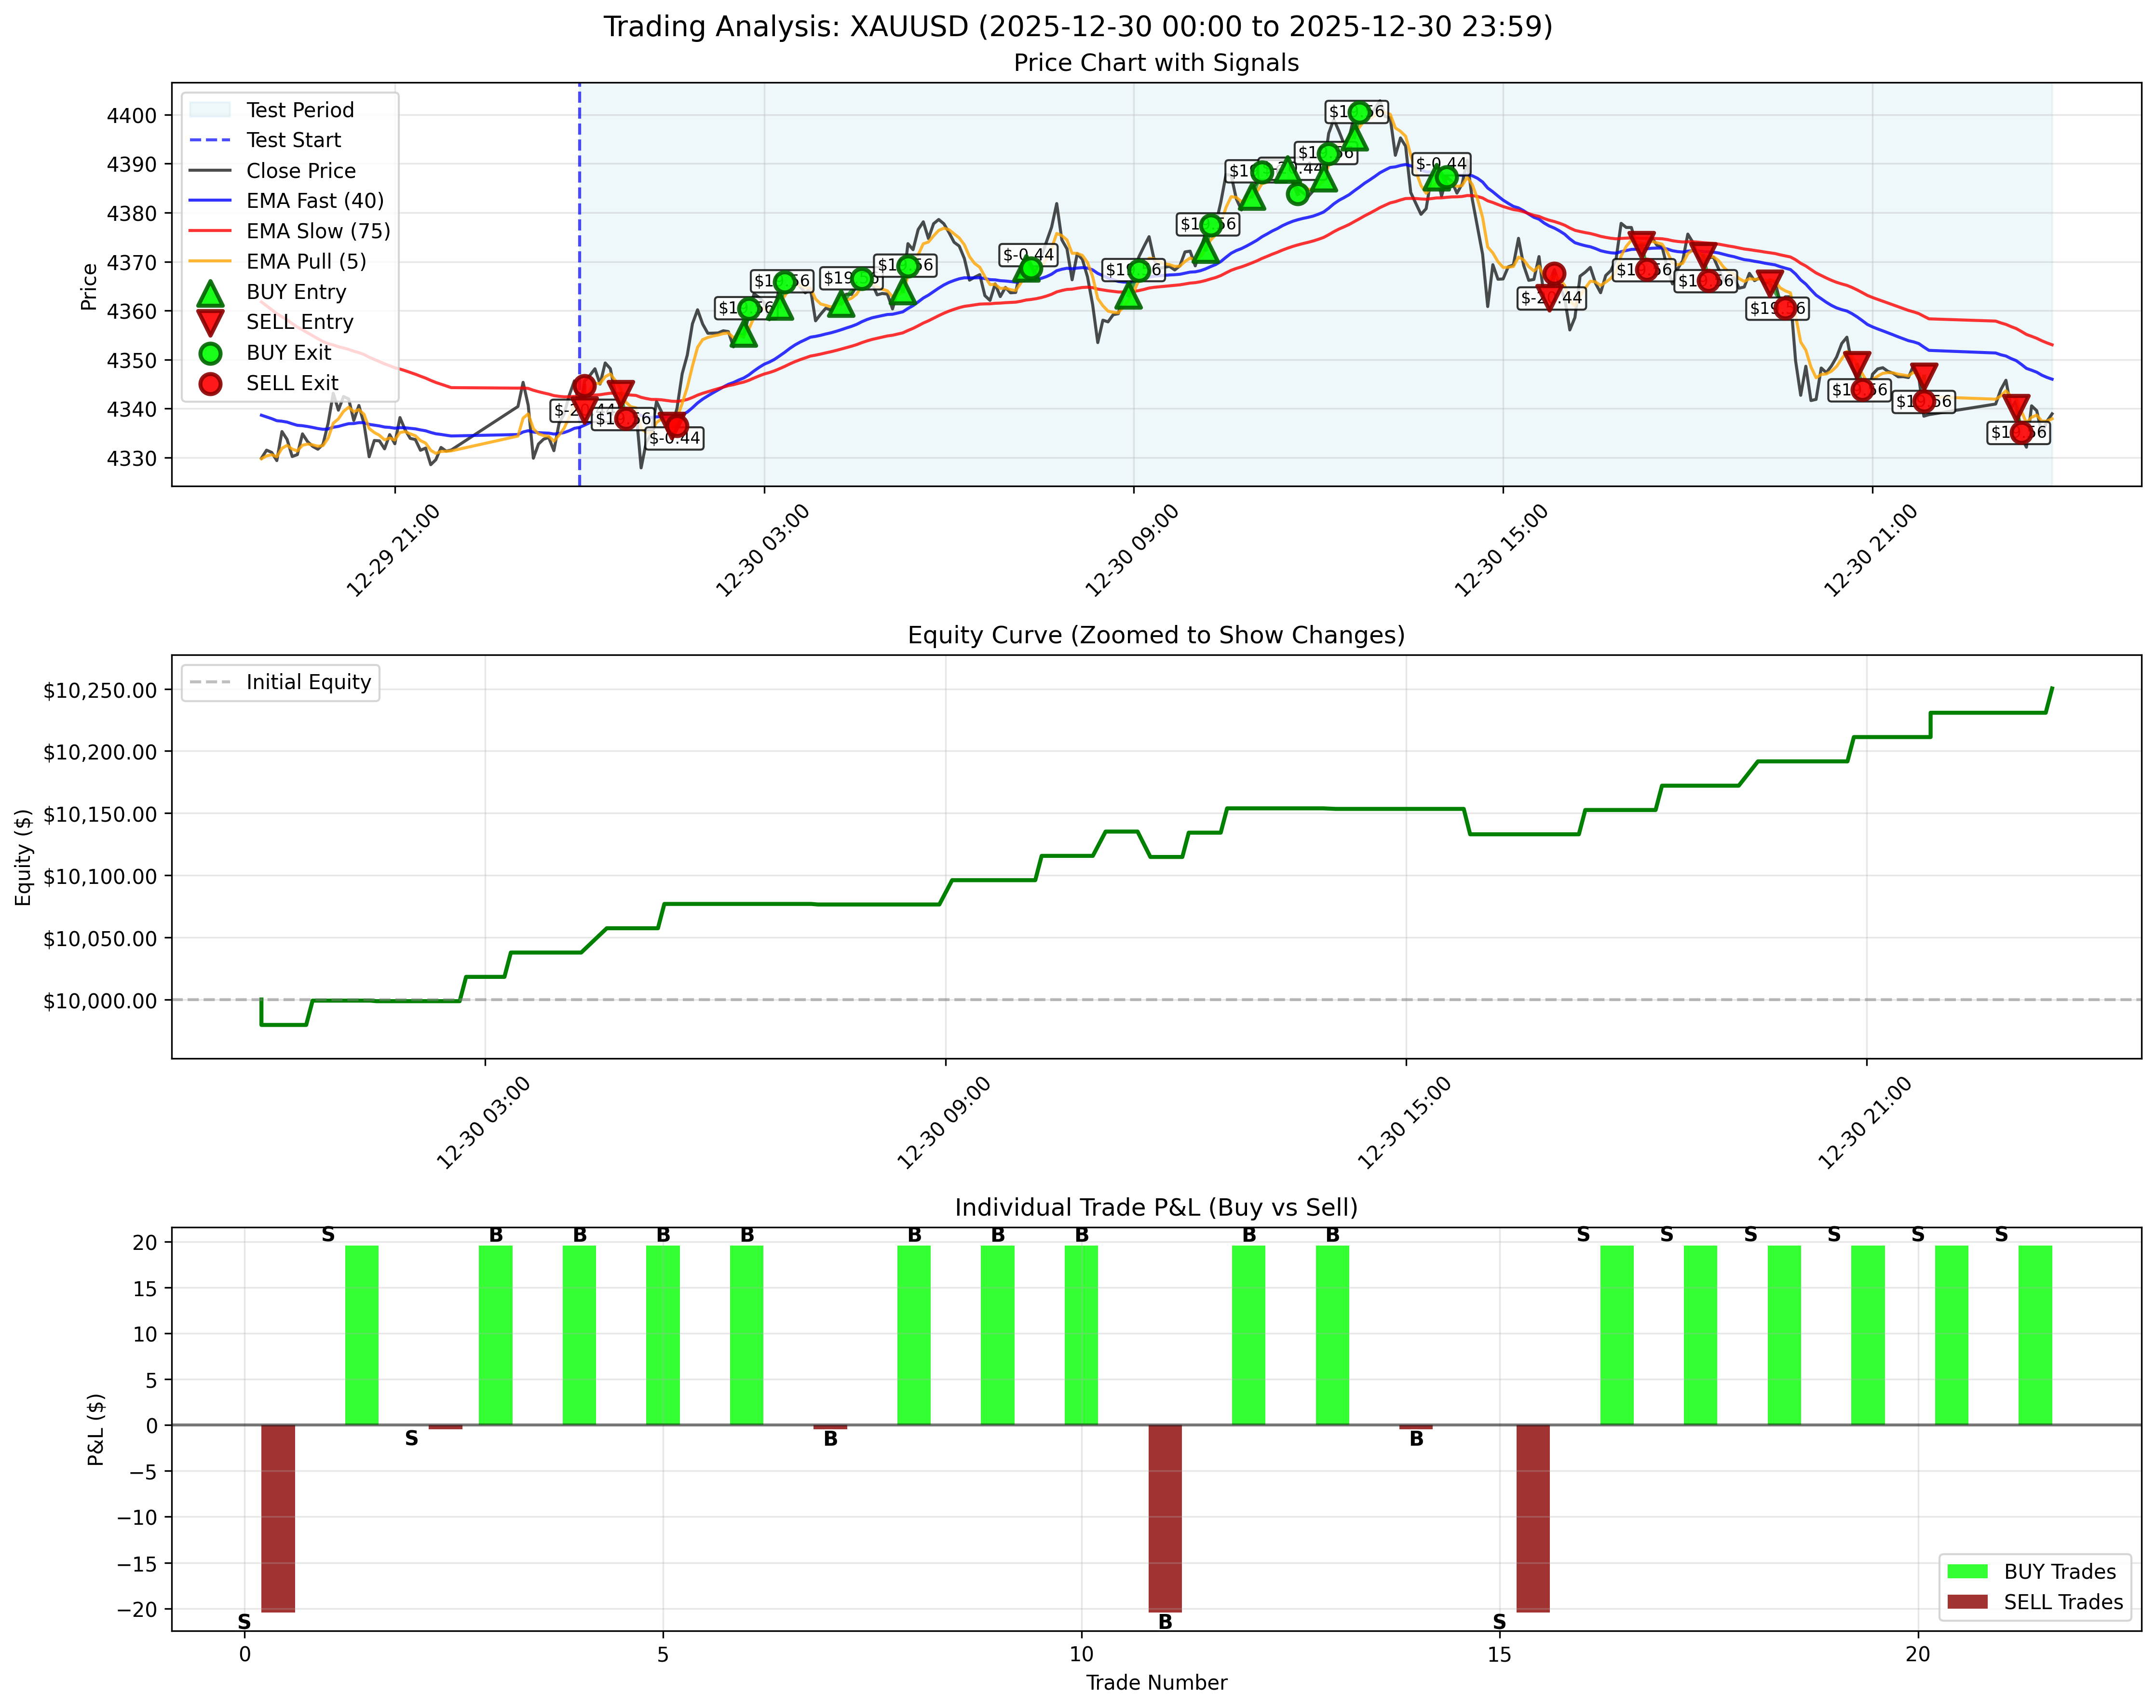
December 30, 2025 - Best Performance Day / 2025年12月30日 - 最高パフォーマンス日
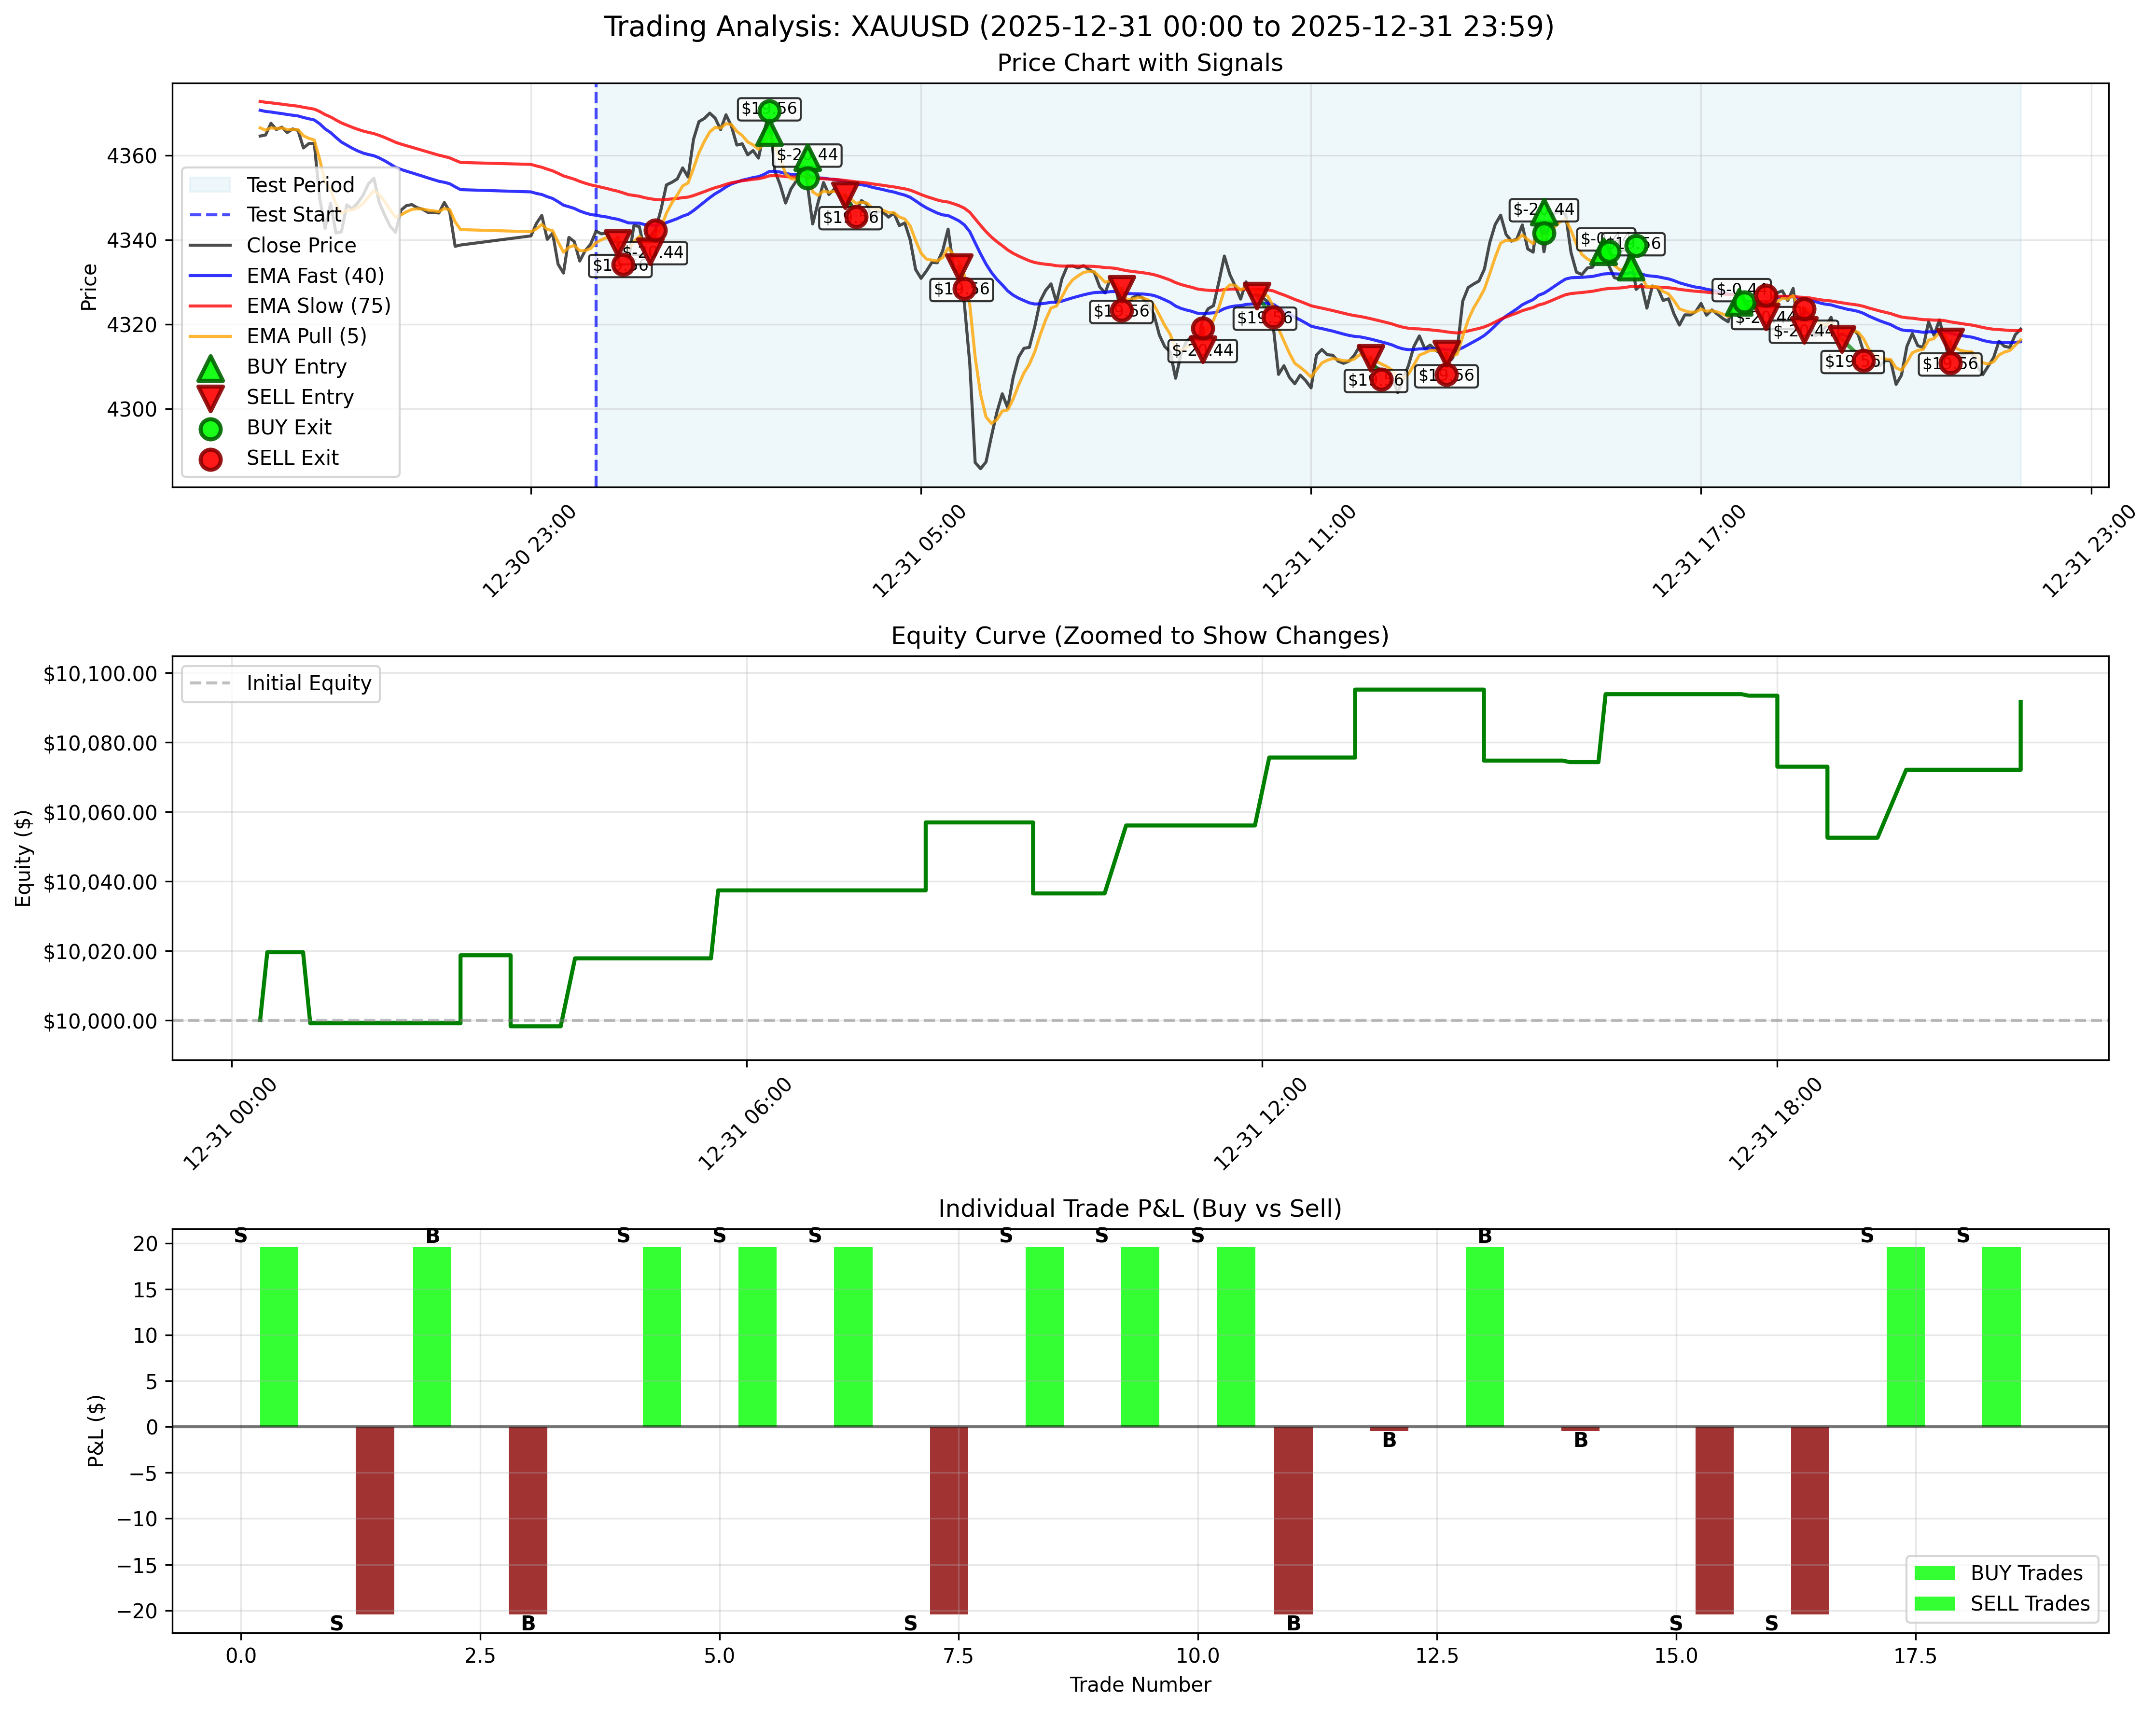
December 31, 2025 / 2025年12月31日
Key Insights / 重要な洞察
With an average win rate of 36.7%, the strategy demonstrates that profitability can be achieved even with a win rate below 40%, thanks to the 2:1 risk/reward ratio. The best-performing days showed win rates above 50%, with December 30 achieving an exceptional 59.1% win rate and $287.20 profit.
平均勝率36.7%で、2:1のリスク/リワード比率により、勝率が40%未満でも収益性を達成できることを示しています。最高パフォーマンス日は50%以上の勝率を示し、12月30日は例外的な59.1%の勝率と$287.20の利益を達成しました。
With 60.9% of trading days being profitable, the strategy shows strong consistency. However, the presence of several significant loss days (particularly December 9 with -$105.14) suggests the need for enhanced risk management during volatile market conditions.
取引日の60.9%が利益を出しており、戦略は強い一貫性を示しています。ただし、いくつかの重要な損失日(特に12月9日の-$105.14)の存在は、変動の激しい市場環境でのリスク管理の強化の必要性を示唆しています。
Our live trading results ($846 profit) exceeded the conservative backtest results ($775.10). This outperformance is due to two key factors: (1) Slippage in live trading can work in our favor, and (2) Our conservative backtest policy assumes Stop Loss is hit first when both SL and TP are triggered in the same bar, which is more pessimistic than real-world execution. This validates the strategy's robustness and shows that conservative backtesting provides a solid foundation for live trading.
ライブ取引結果($846の利益)は保守的なバックテスト結果($775.10)を上回りました。この優位性は2つの主要な要因によるものです:(1)ライブ取引でのスリッページが有利に働く場合があり、(2)保守的なバックテストポリシーは、同じバーでSLとTPの両方がトリガーされた場合、SLが最初にヒットしたと仮定し、実世界の執行よりも悲観的です。これは戦略の堅牢性を検証し、保守的なバックテストがライブ取引の強固な基盤を提供することを示しています。
The trailing stop mechanism (enabled with 4-point step and 2-point distance) helped protect profits on winning trades, contributing to the overall positive performance despite the moderate win rate. This was particularly evident on high-profit days like December 30.
トレーリングストップメカニズム(4ポイントのステップと2ポイントの距離で有効)は、勝ち取引の利益を保護し、中程度の勝率にもかかわらず全体的なプラスパフォーマンスに貢献しました。これは12月30日などの高利益日で特に顕著でした。
The December 2025 backtest demonstrates that our TREND strategy is capable of generating consistent profits in the gold market, achieving a 7.75% return over 23 trading days with a 36.7% win rate, starting with $10,000 initial capital. The strategy's ability to maintain profitability despite a win rate below 40% highlights the importance of proper risk/reward management.
2025年12月のバックテストは、TREND戦略が金市場で一貫した利益を生み出す能力があることを示しており、$10,000の初期資本で36.7%の勝率を達成し、23取引日に7.75%のリターンを達成しました。勝率が40%未満にもかかわらず収益性を維持する戦略の能力は、適切なリスク/リワード管理の重要性を強調しています。
Most importantly, our live trading results ($846 profit) exceeded the conservative backtest results ($775.10), demonstrating the strategy's real-world effectiveness. The difference is due to slippage and our conservative backtest policy (assuming Stop Loss hits first when both SL and TP are triggered in the same static K-line bar). This validates that our TREND strategy not only works in backtesting but performs well in live market conditions. Due to this excellent performance, we're upgrading from 0.01 to 0.04 lot (4x) next month - stay tuned for even better results!
最も重要なのは、ライブ取引結果($846の利益)が保守的なバックテスト結果($775.10)を上回り、戦略の実世界での有効性を示したことです。この違いは、スリッページと保守的なバックテストポリシー(同じ静的K線バーでSLとTPの両方がトリガーされた場合、SLが最初にヒットしたと仮定)によるものです。これは、TREND戦略がバックテストだけでなく、ライブ市場条件でも良好に機能することを検証しています。この優れたパフォーマンスにより、来月から0.01ロットから0.04ロット(4倍)にアップグレードします - さらなる結果にご期待ください!
Note: Past performance does not guarantee future results. This backtest is for educational and research purposes. Always conduct thorough testing and risk assessment before deploying any trading strategy with real capital.
注意: 過去のパフォーマンスは将来の結果を保証するものではありません。このバックテストは教育および研究目的のものです。実際の資本で取引戦略を展開する前に、常に徹底的なテストとリスク評価を実施してください。